A series is not like a regular variable. It can be considered a “dataset” within your main dataset with repeating observations of one or more variables. Series should be used in case of repeated measurements. This implies that for optimal use of series, planning a project and building the dataset should be thought through before data collection starts. A series can contain just one single variable (e.g. weight measurements) or multiple variables (e.g. a large panel of blood samples).
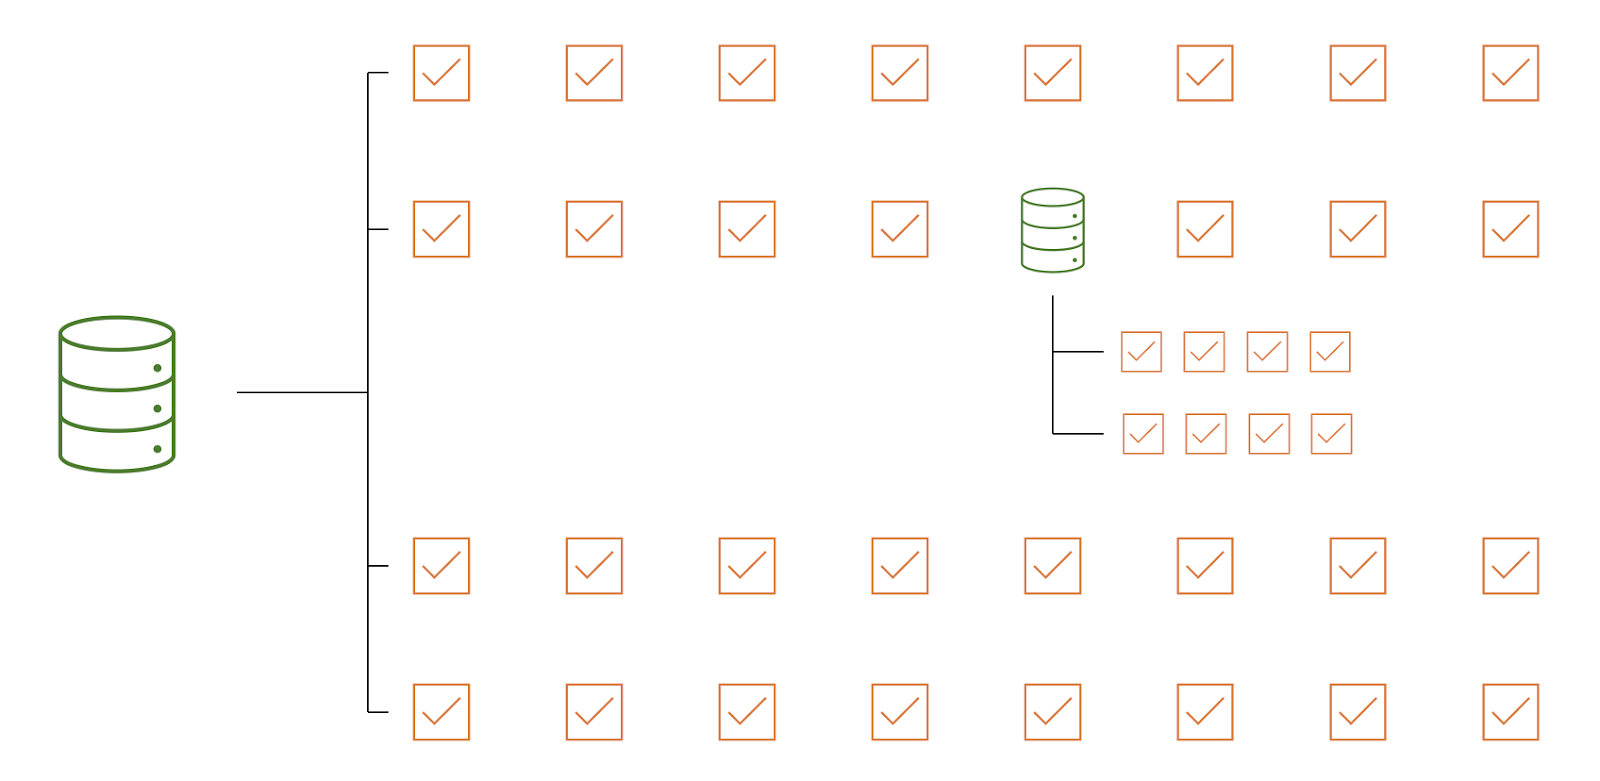
Figure 1: Visualisation of series dataset layout
Main-level or series-level variables?
When is it best to gather variables in a series instead of having them on the main level? When a project contains repeated measurements, the use of series is recommended. Some examples include:
1. Variables examined at different points in time (e.g. weight at different study visits, Quality of Life measured at baseline and subsequent visits)
2. Variables with large between-patient variations in the number of answers (e.g. details of medication use or previous surgeries)
Like main-level variables, series-level variables can be gathered in groups to maintain oversight and structure in the project. Additionally, unique forms can be created based on series variables.
There are several advantages of using series:
1. Several data points are stored in one entry (i.e. in one row of your dataset), keeping your data nice and tidy.
2. The number of variables used is reduced substantially. This is helpful, especially in larger projects, to maintain oversight and structure your project.
3. Improved dataset setup and workflow while inputting data.
Analysis of series data
Analyses in Ledidi can be performed on both main-level and series-level data.
Main-level analysis
Variables within a series can be aggregated by using aggregation rules, and the aggregated values can then be used for analysis on the main level. Examples of aggregation rules include: the sum of a numerical variable across series entries; the latest value of the series variable registered; or the average value of a series variable. The aggregated variables will be shown in the dataset window and are available for statistical analysis and graphical presentation on the main level.
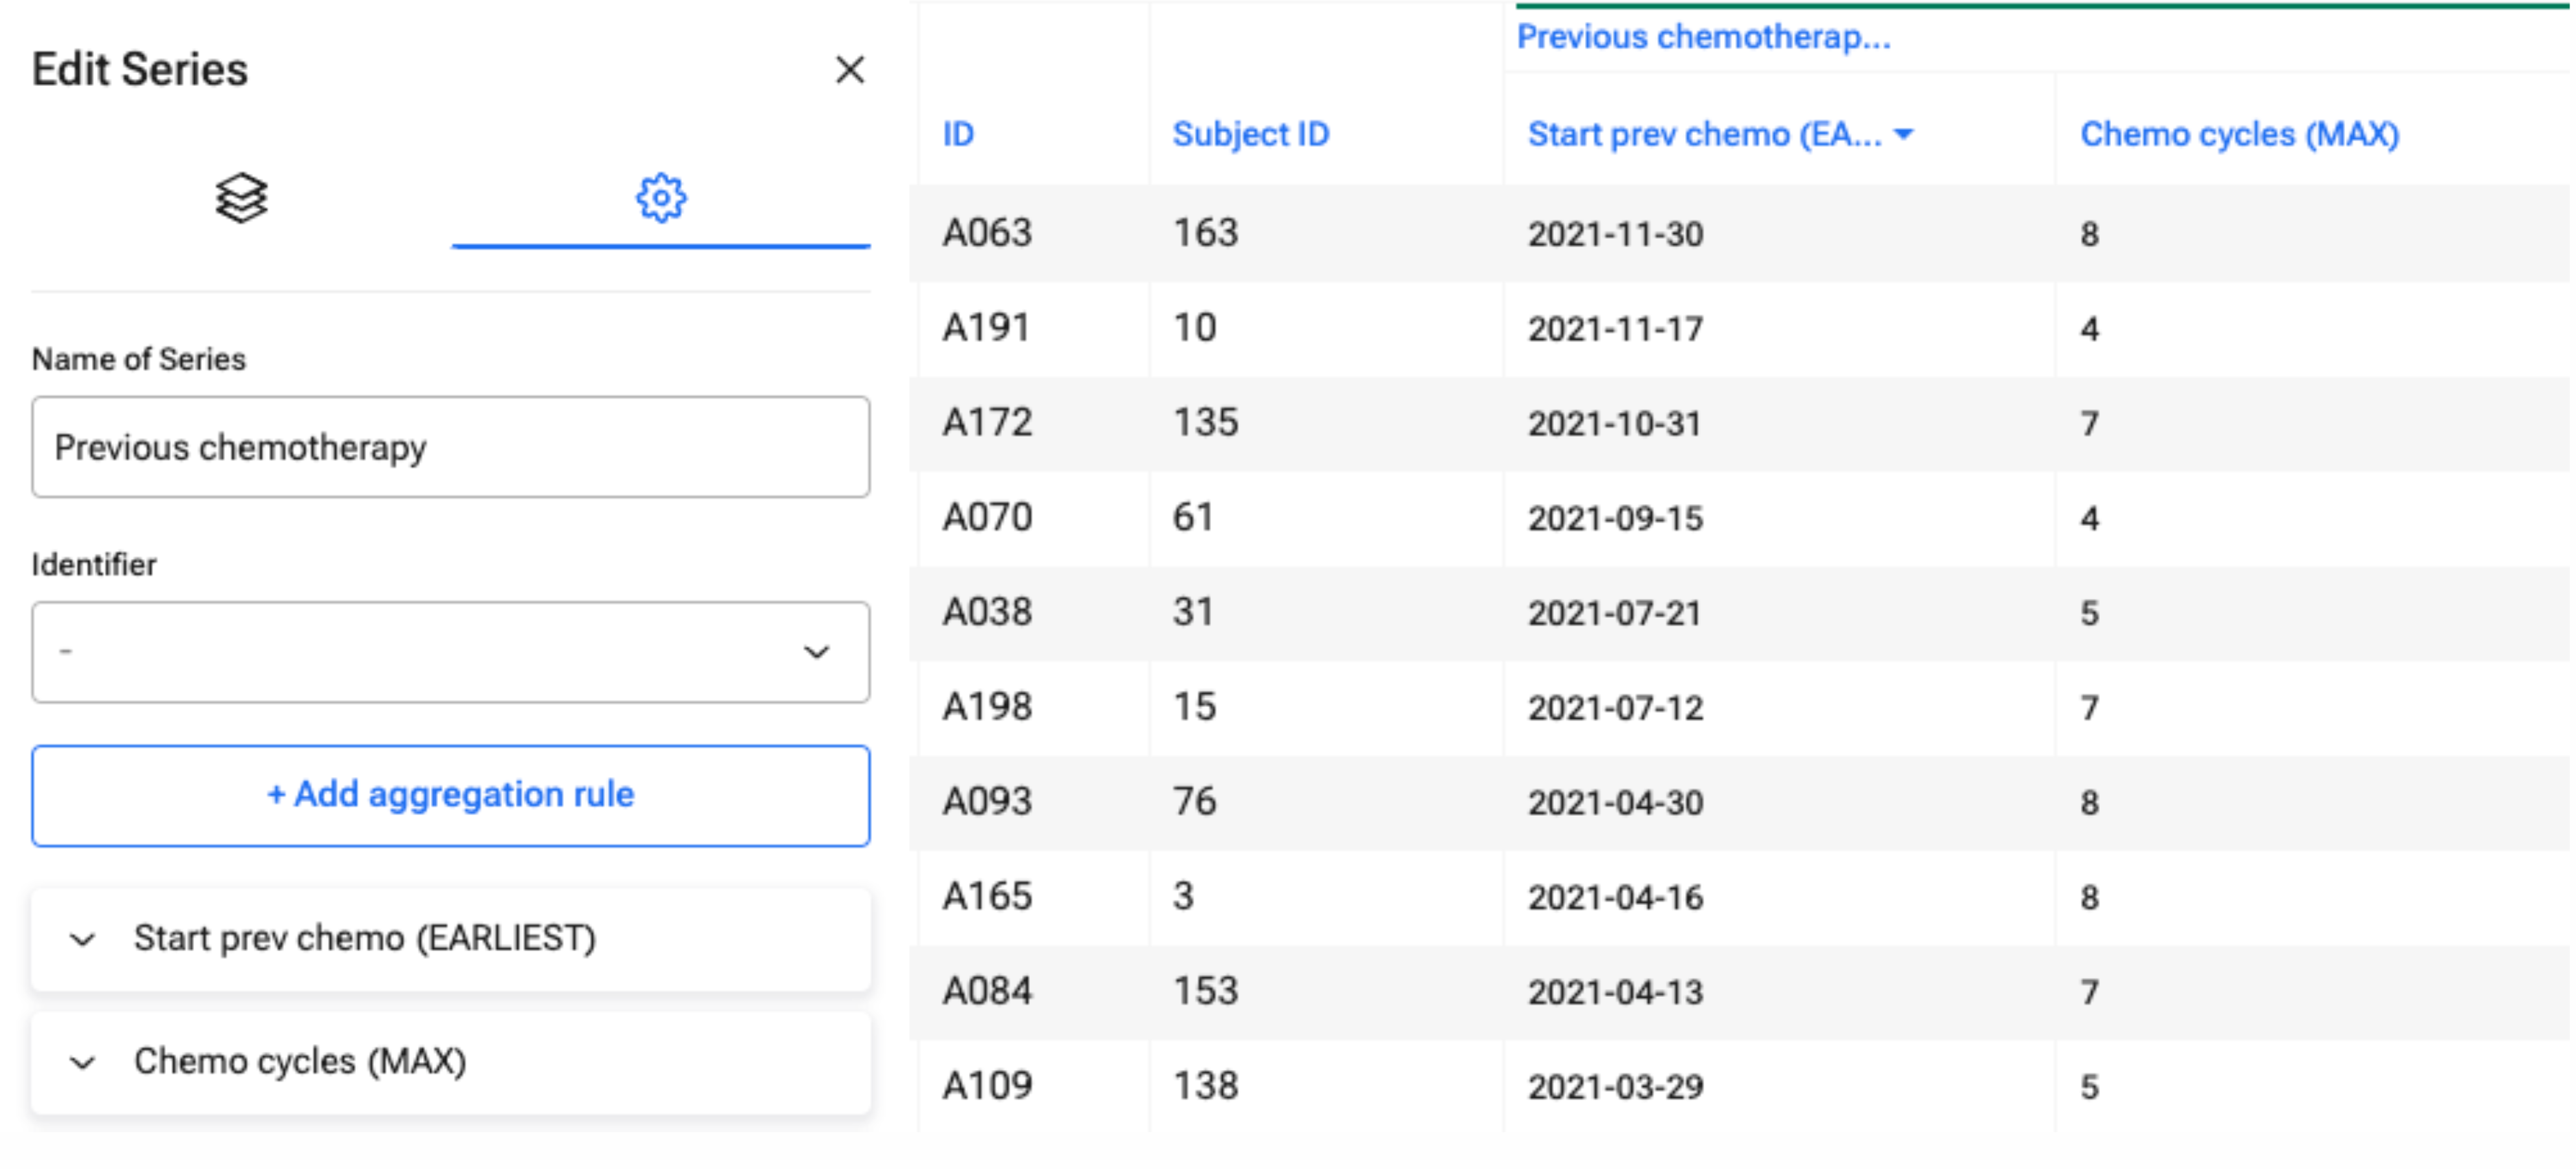
Figure 2: Setup of aggregation rules in the Variables window (left) and view of these rules in the Dataset window (right).
In this scenario, not all data points in the series are used; but rather an aggregated variable generated from series data. This limits the nature of the analysis that can be undertaken on series-level data at the main level.
Series-level analysis
If the goal is to analyse all data points in a series, analyses on the series level are required. Analysis at this level facilitates a more comprehensive examination of series-level data.
For example, if one takes blood pressure measurements at each GP visit, the average values across all patients at each visit can be plotted using time course analysis. One can choose between the mean or the median value, and add 95% confidence intervals, standard deviations, and range or IQR in the case of median values. One can also stratify by other variables to ascertain whether there are different patterns by sex, age, site, etc. as shown in Figure 3.
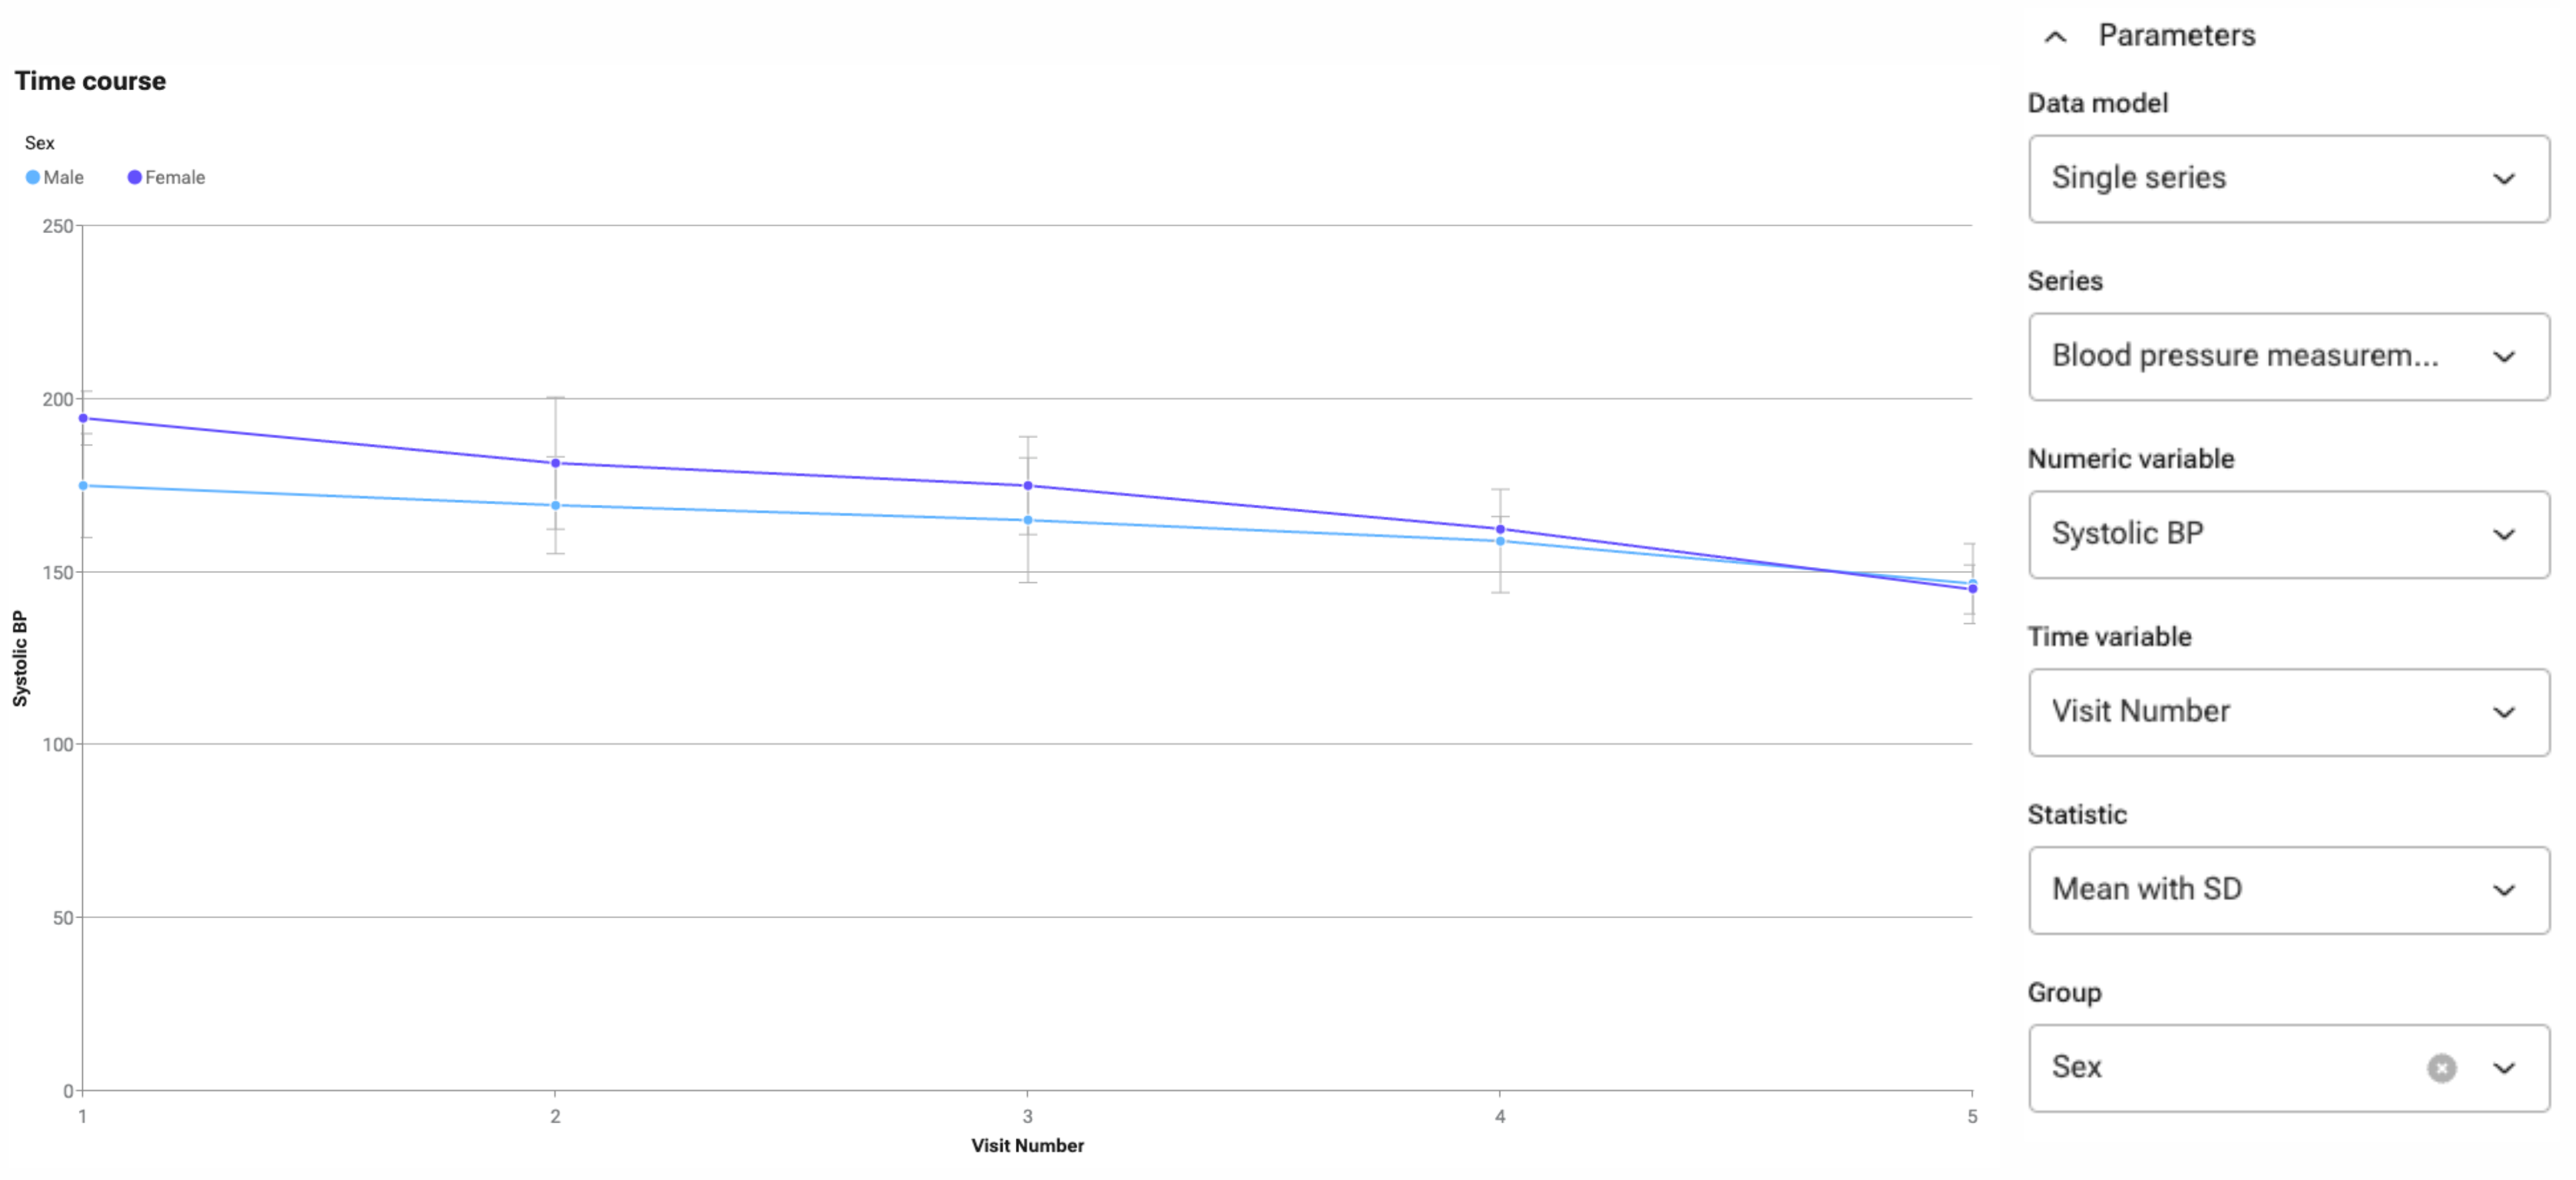
Figure 3: Mean systolic blood pressure with standard deviation of all patients, per GP visit, stratified by sex.
Additionally, the individual patient blood pressure measurements over time can be plotted as shown in Figure 4, by choosing the patient ID variable as the Group function. (Hint: To obtain this graph, the datatype of the ID variable should be “Unique” or “integer”.)
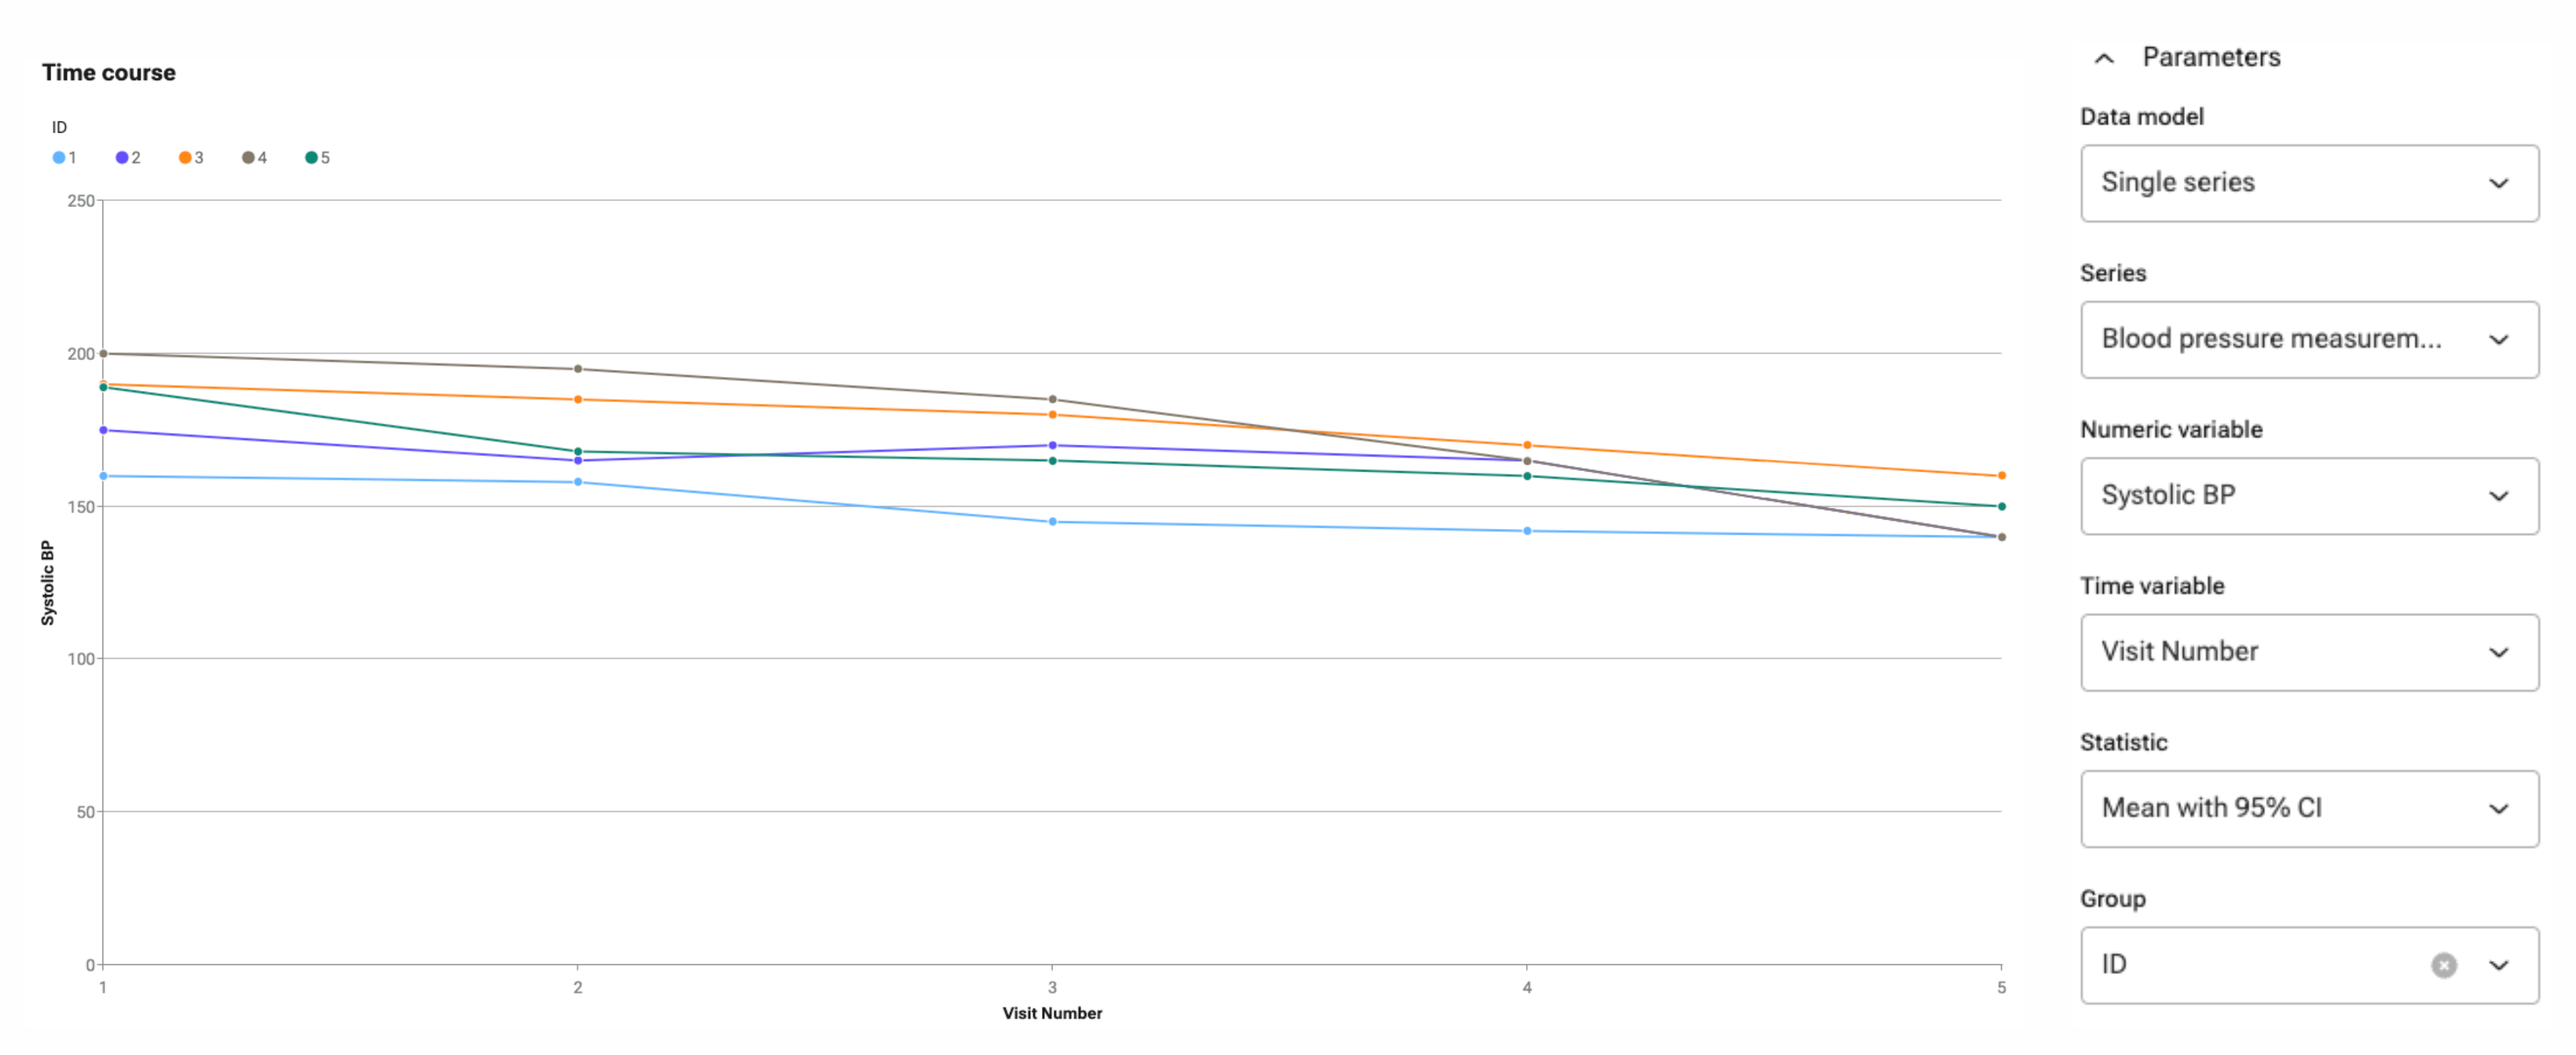
Figure 4: The systolic blood pressure of each individual patient per GP visit.
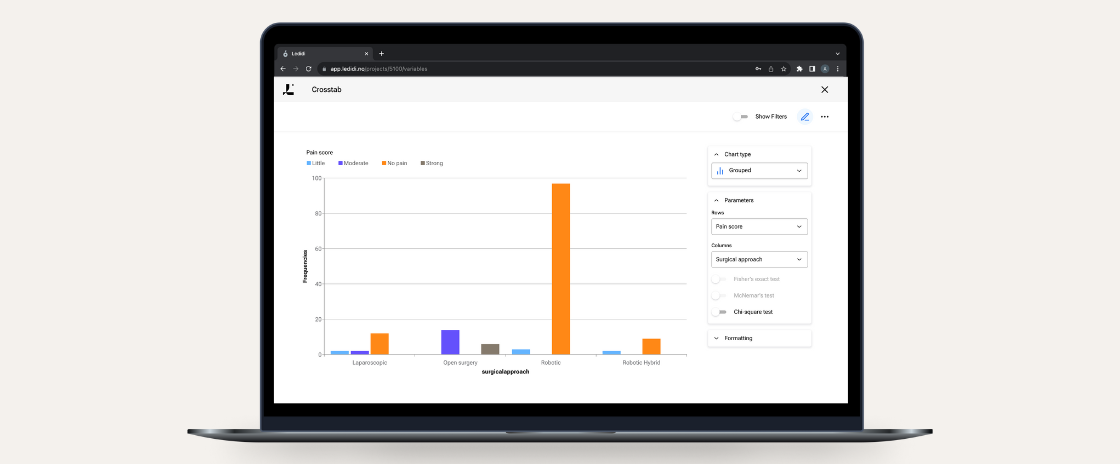
Another application of series analysis is examining the frequency of a categorical value in a data series among all entries. For example, this would be relevant in examining the distribution of previous surgery types among patients in a breast cancer trial. Here, prior surgical procedures are entered in a series, given that a patient can have multiple prior surgeries. Using the “Frequencies” analysis on the series level provides insight into how often each surgery type has been performed.
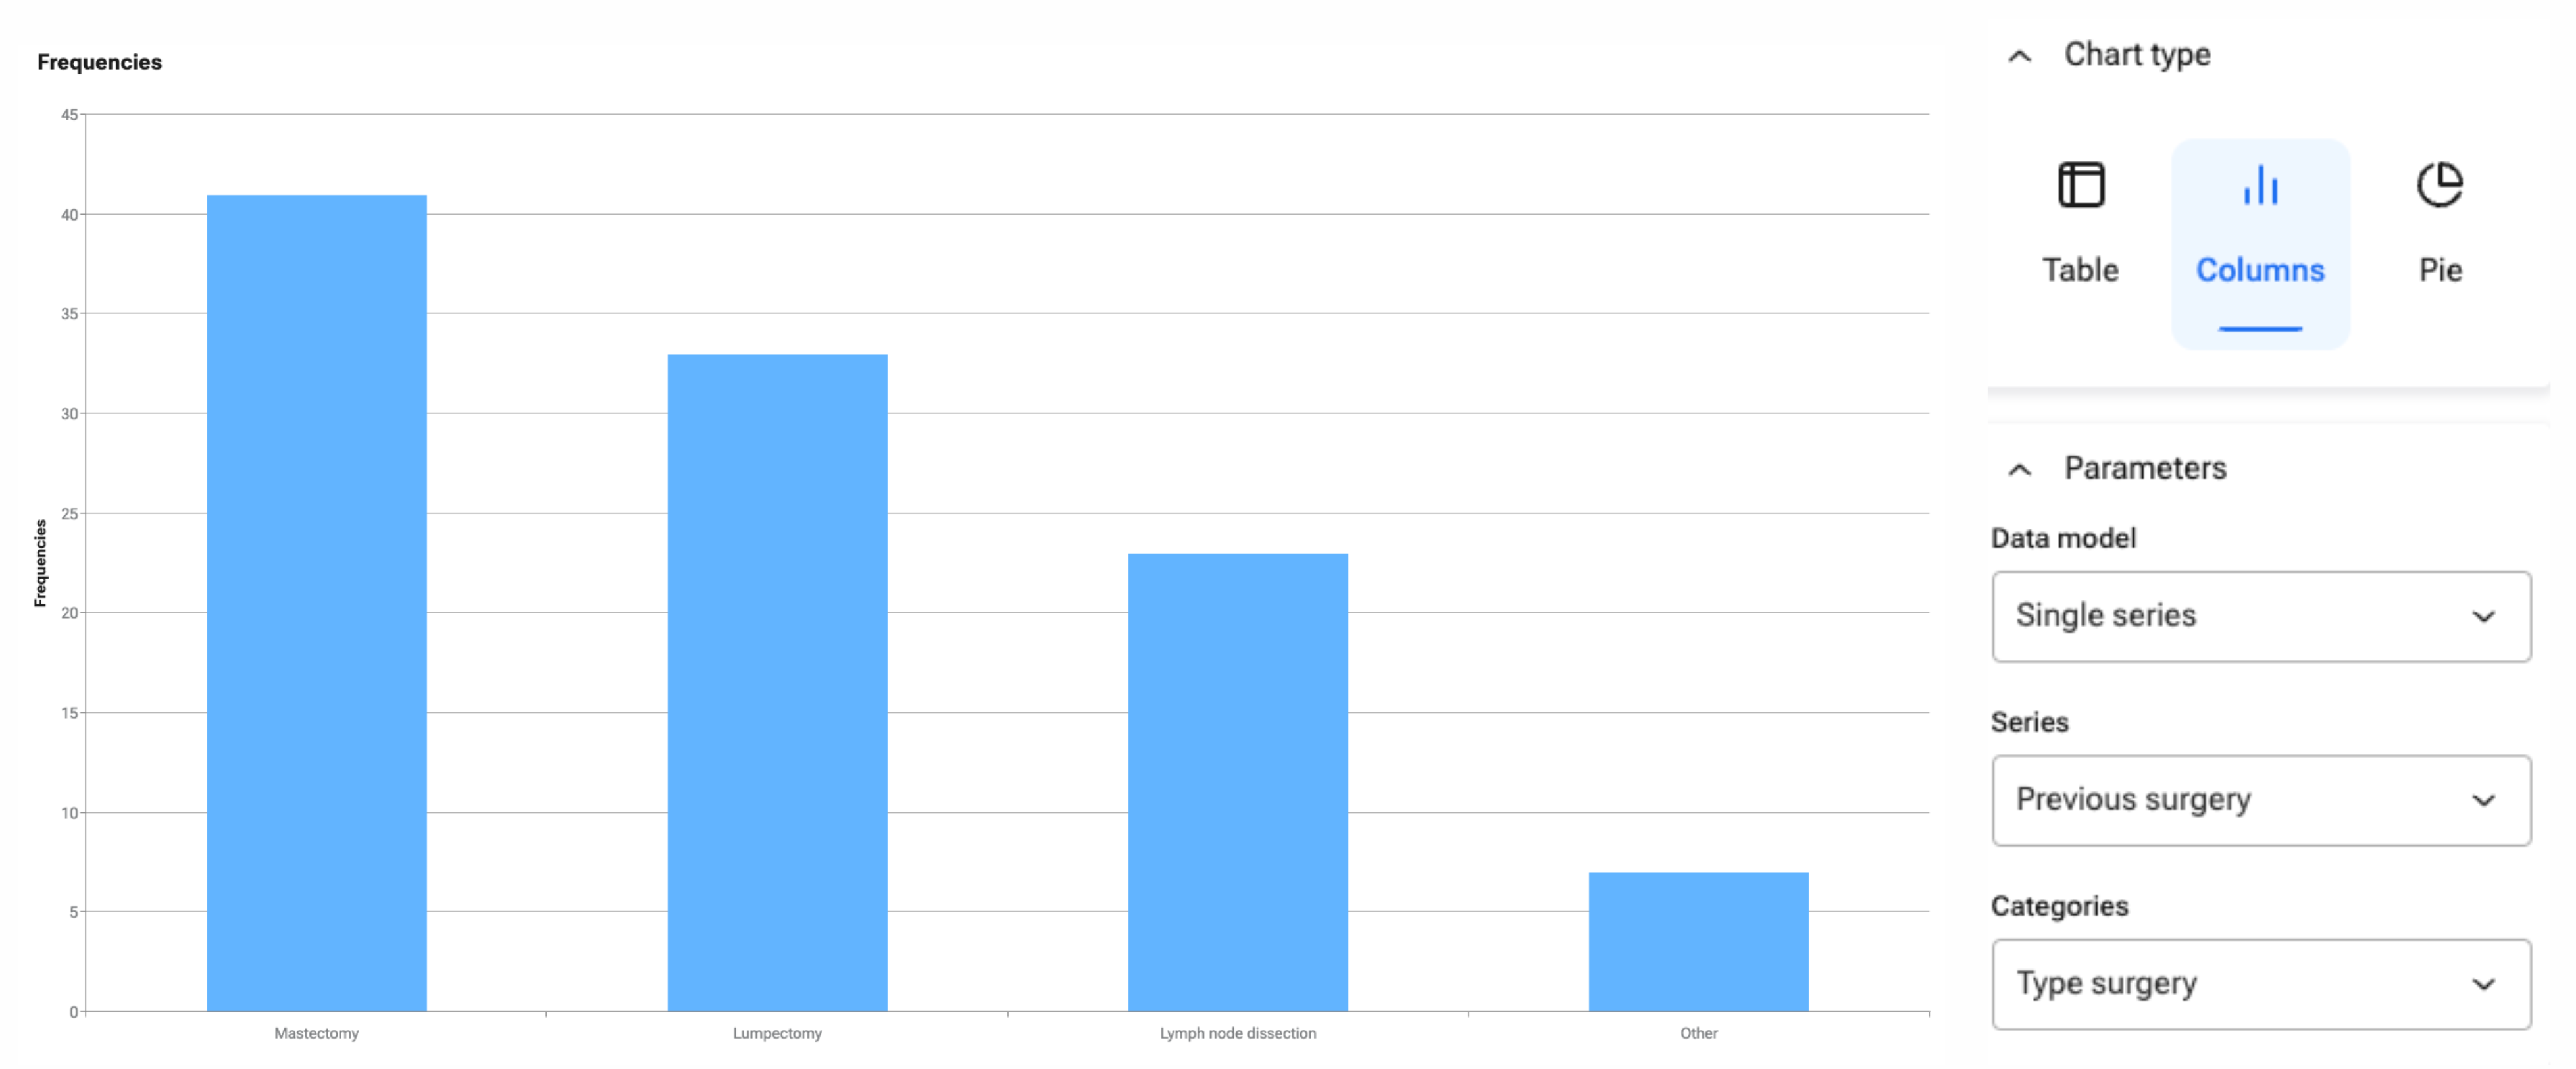
Figure 5: Frequency of previously performed surgeries among all patients in a breast cancer trial. Because the variable “Previous surgery” is a data series, each patient may have had multiple previous procedures.
Conclusion
When a project contains repeated measurements, series are highly recommended for optimal data gathering and analysis. Series-level data can be analysed on two different levels:
1. On the main level by using an aggregation rule thereby making the sum/mean/latest value/... of series-level data available for main-level analysis.
2. On the series level by applying Ledidi Core’s analyses on series-level data thereby analysing each individual data point within a certain series.