Clinical Audits and Registries
Design studies, collaborate, and analyse. All in one platform.
Effortlessly create and manage your projects with a user-friendly, drag-and-drop interface. Build structured data capture forms, define variables, and import existing datasets or spreadsheets with ease. Seamlessly integrate with other software using our API for maximum flexibility. Collaborate in real time and gain immediate insights through built-in statistical analysis and data visualisation tools — all while preserving the privacy and confidentiality of your underlying data.
You focus on the questions and the insights—we'll take care of the technical structuring in the background.
- Easily manage variables, including calculated fields and dynamic updates through importing data into existing datasets.
- Use the drag-and-drop interface to design intuitive forms, making it simple to structure your study from the outset.
- Import data from Excel or CSV files effortlessly, whether you're launching a new project or enriching an existing one.
- Invite team members to collaborate, assigning roles and permissions to manage access and contributions securely.
- Access a comprehensive suite of built-in descriptive and comparative statistical tools — no coding required.
- Build custom dashboards to visualise your data in real time and track project progress with clarity.
- Export results directly from the analysis panel for reporting, sharing, or further processing.
Direct data entry
Based on your defined variables, entry forms are generated automatically, allowing immediate data entry. The intuitive interface enables the creation of separate forms for different aspects of your study.
Track your study’s progress by defining and setting statuses on data entries. Case report forms can be adapted in minutes using the intuitive drag-and-drop functionality.
Ready to use — straight away
There’s no need to prepare data, reorganise columns and rows, introduce grouping variables, or search for missing data. Your data is always ready for analysis, with no risk of errors being introduced during filtering, analysis, or export by collaborators.
All statistical analyses can be performed directly on the dataset through a user-friendly interface. Users don’t even need access to the raw data to derive full value from it.
Say goodbye to complex statistical software
Clinical audits and registry features an intuitive and user-friendly analysis panel that caters to all collaborators — safely. There’s no risk of data contamination during analysis.
Explore data across sub-groups
Choose to analyse the entire dataset or apply filters to focus on specific subsets. All results are recalculated in real time based on your filters.
You can filter datasets using categorical, numerical, date, and text variables.
Instantly ready for presentation and publication
Export results as tables, graphs, and charts that can be readily inserted into presentations or publications. Tables are exported as CSV files, while graphics are available as SVG files — suitable for both digital and print use.
Use the analysis panel for live presentations
Live analysis is a powerful way to engage your audience. The raw data remains hidden, ensuring both clarity and confidentiality.
API integration
The plattform APIs supports a wide range of integration scenarios, including import, export, update, and delete operations. This allows the plattform to be seamlessly integrated into your existing data ecosystem.
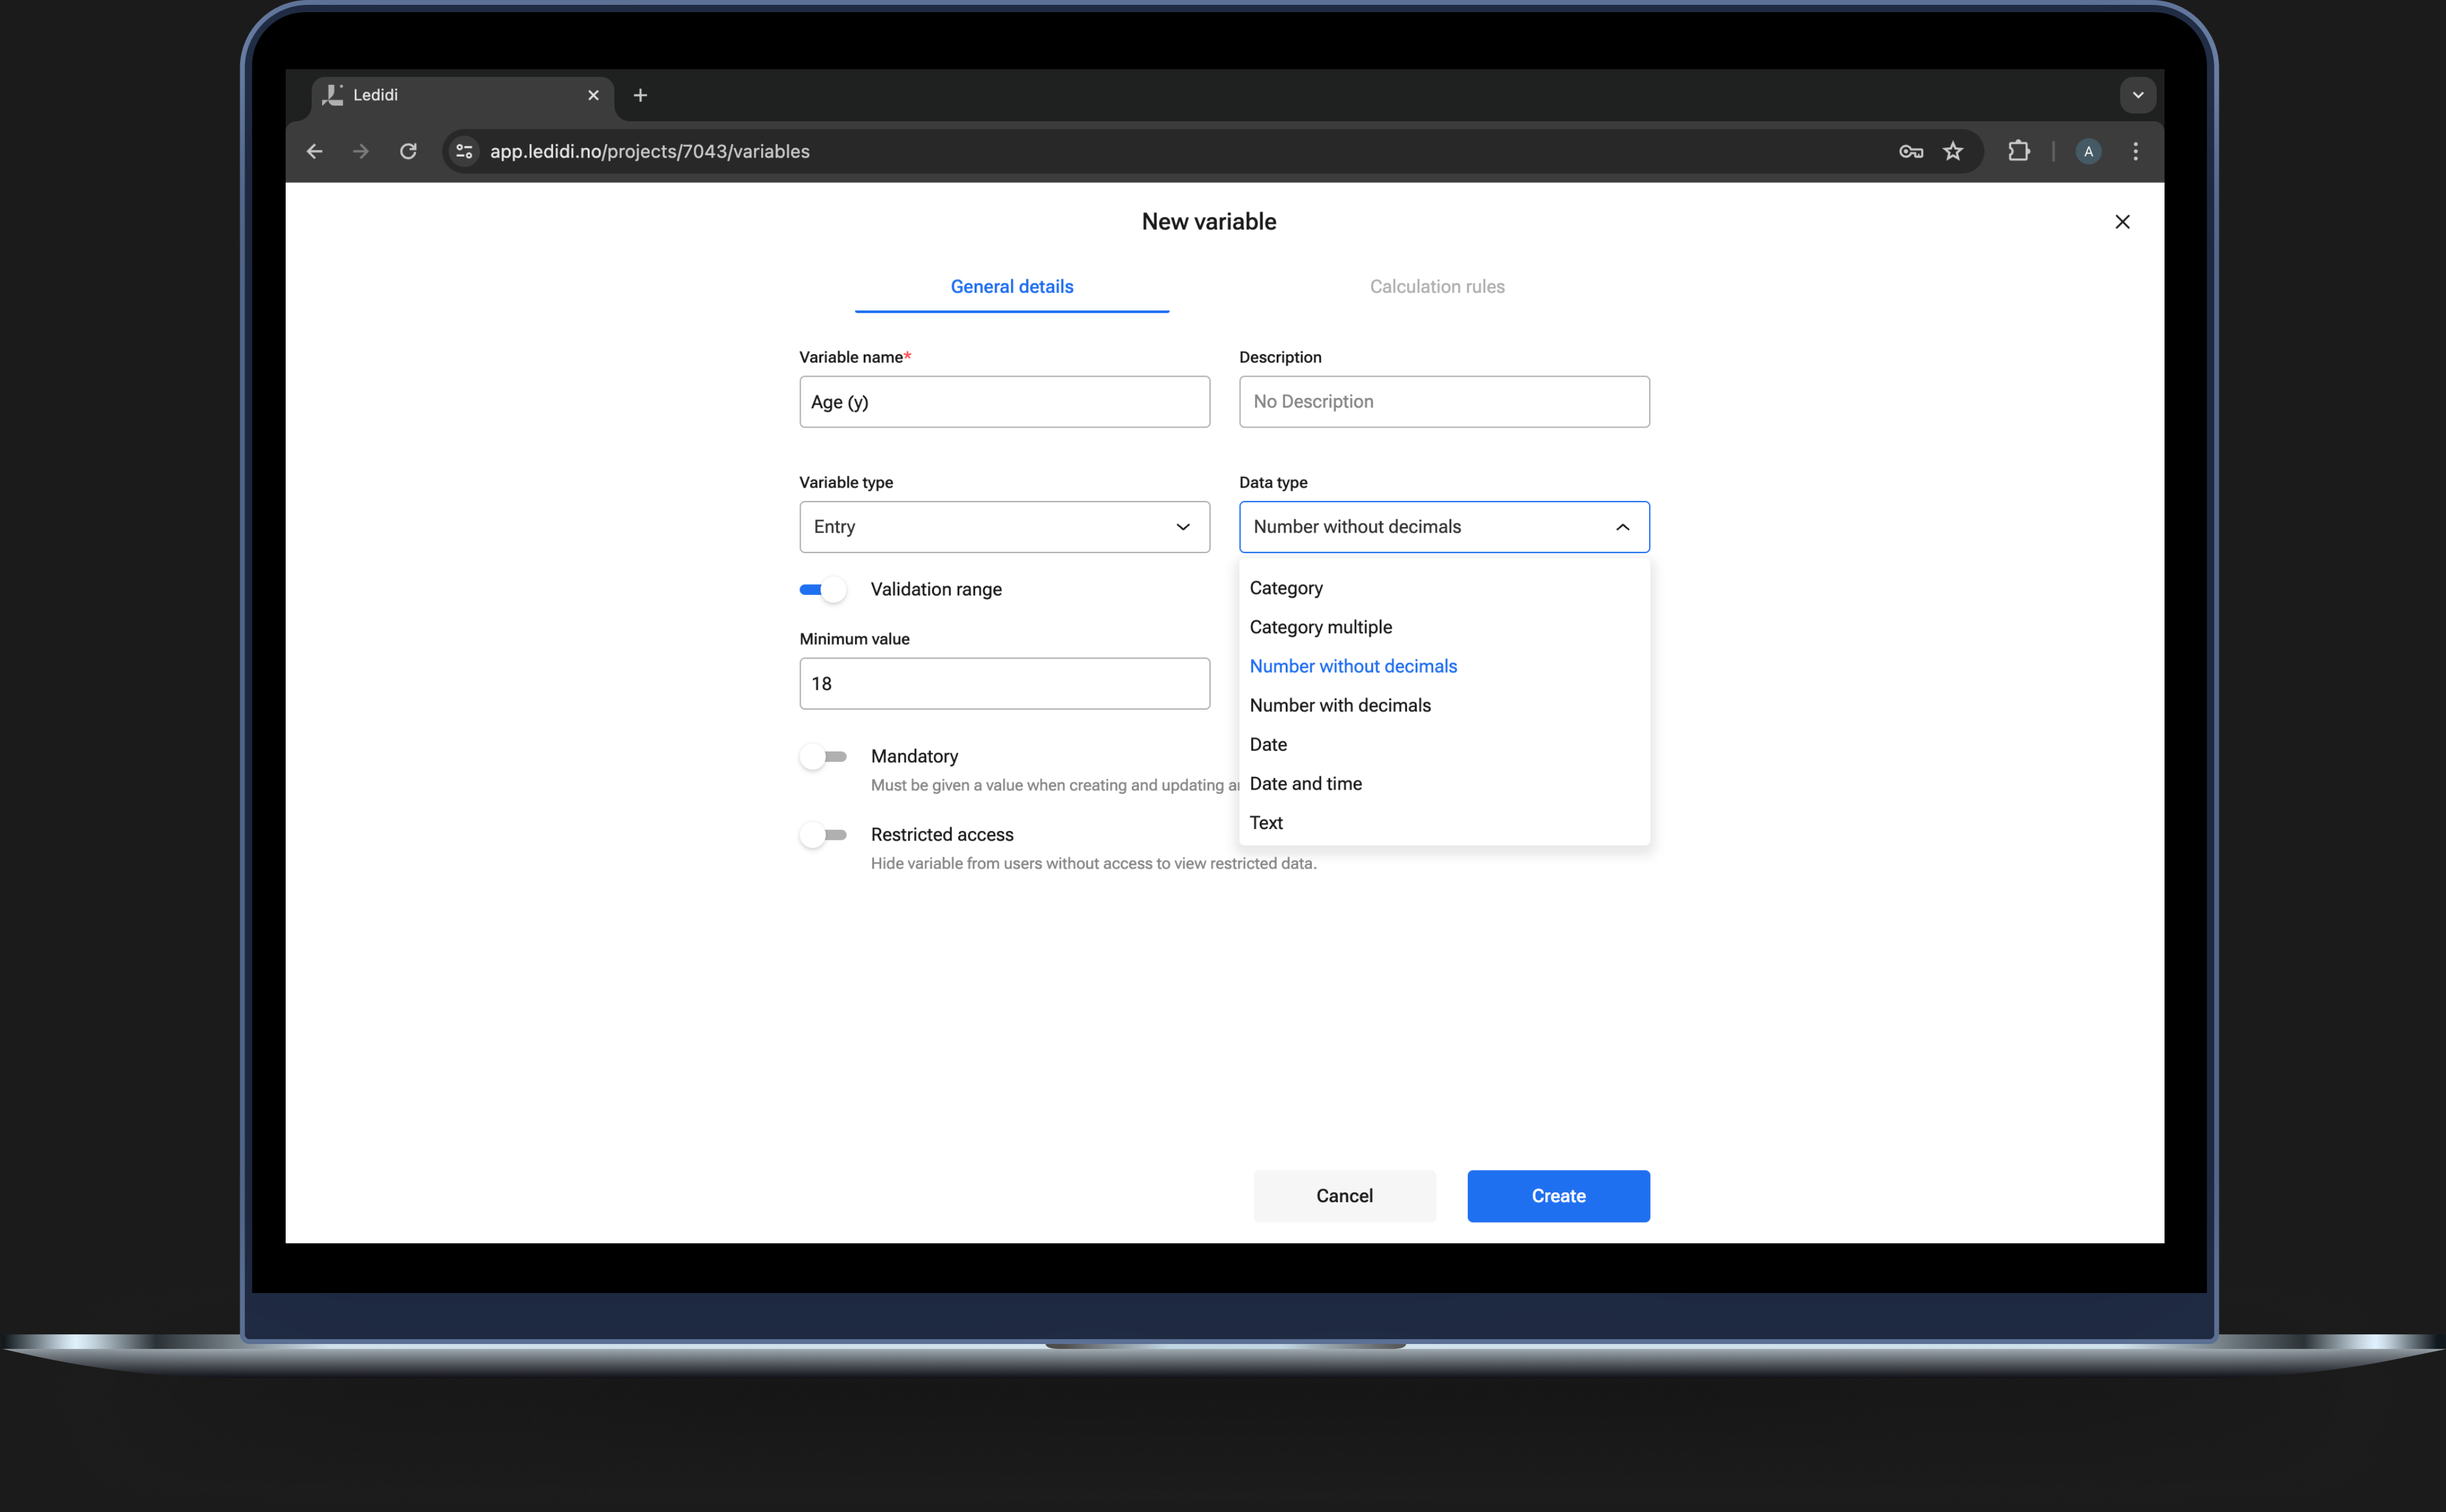
Do it from scratch, or use an imported dataset
Define and organise all the variables you need.
Supported variables include categoric, numeric, date, duration, text and file/image formats.
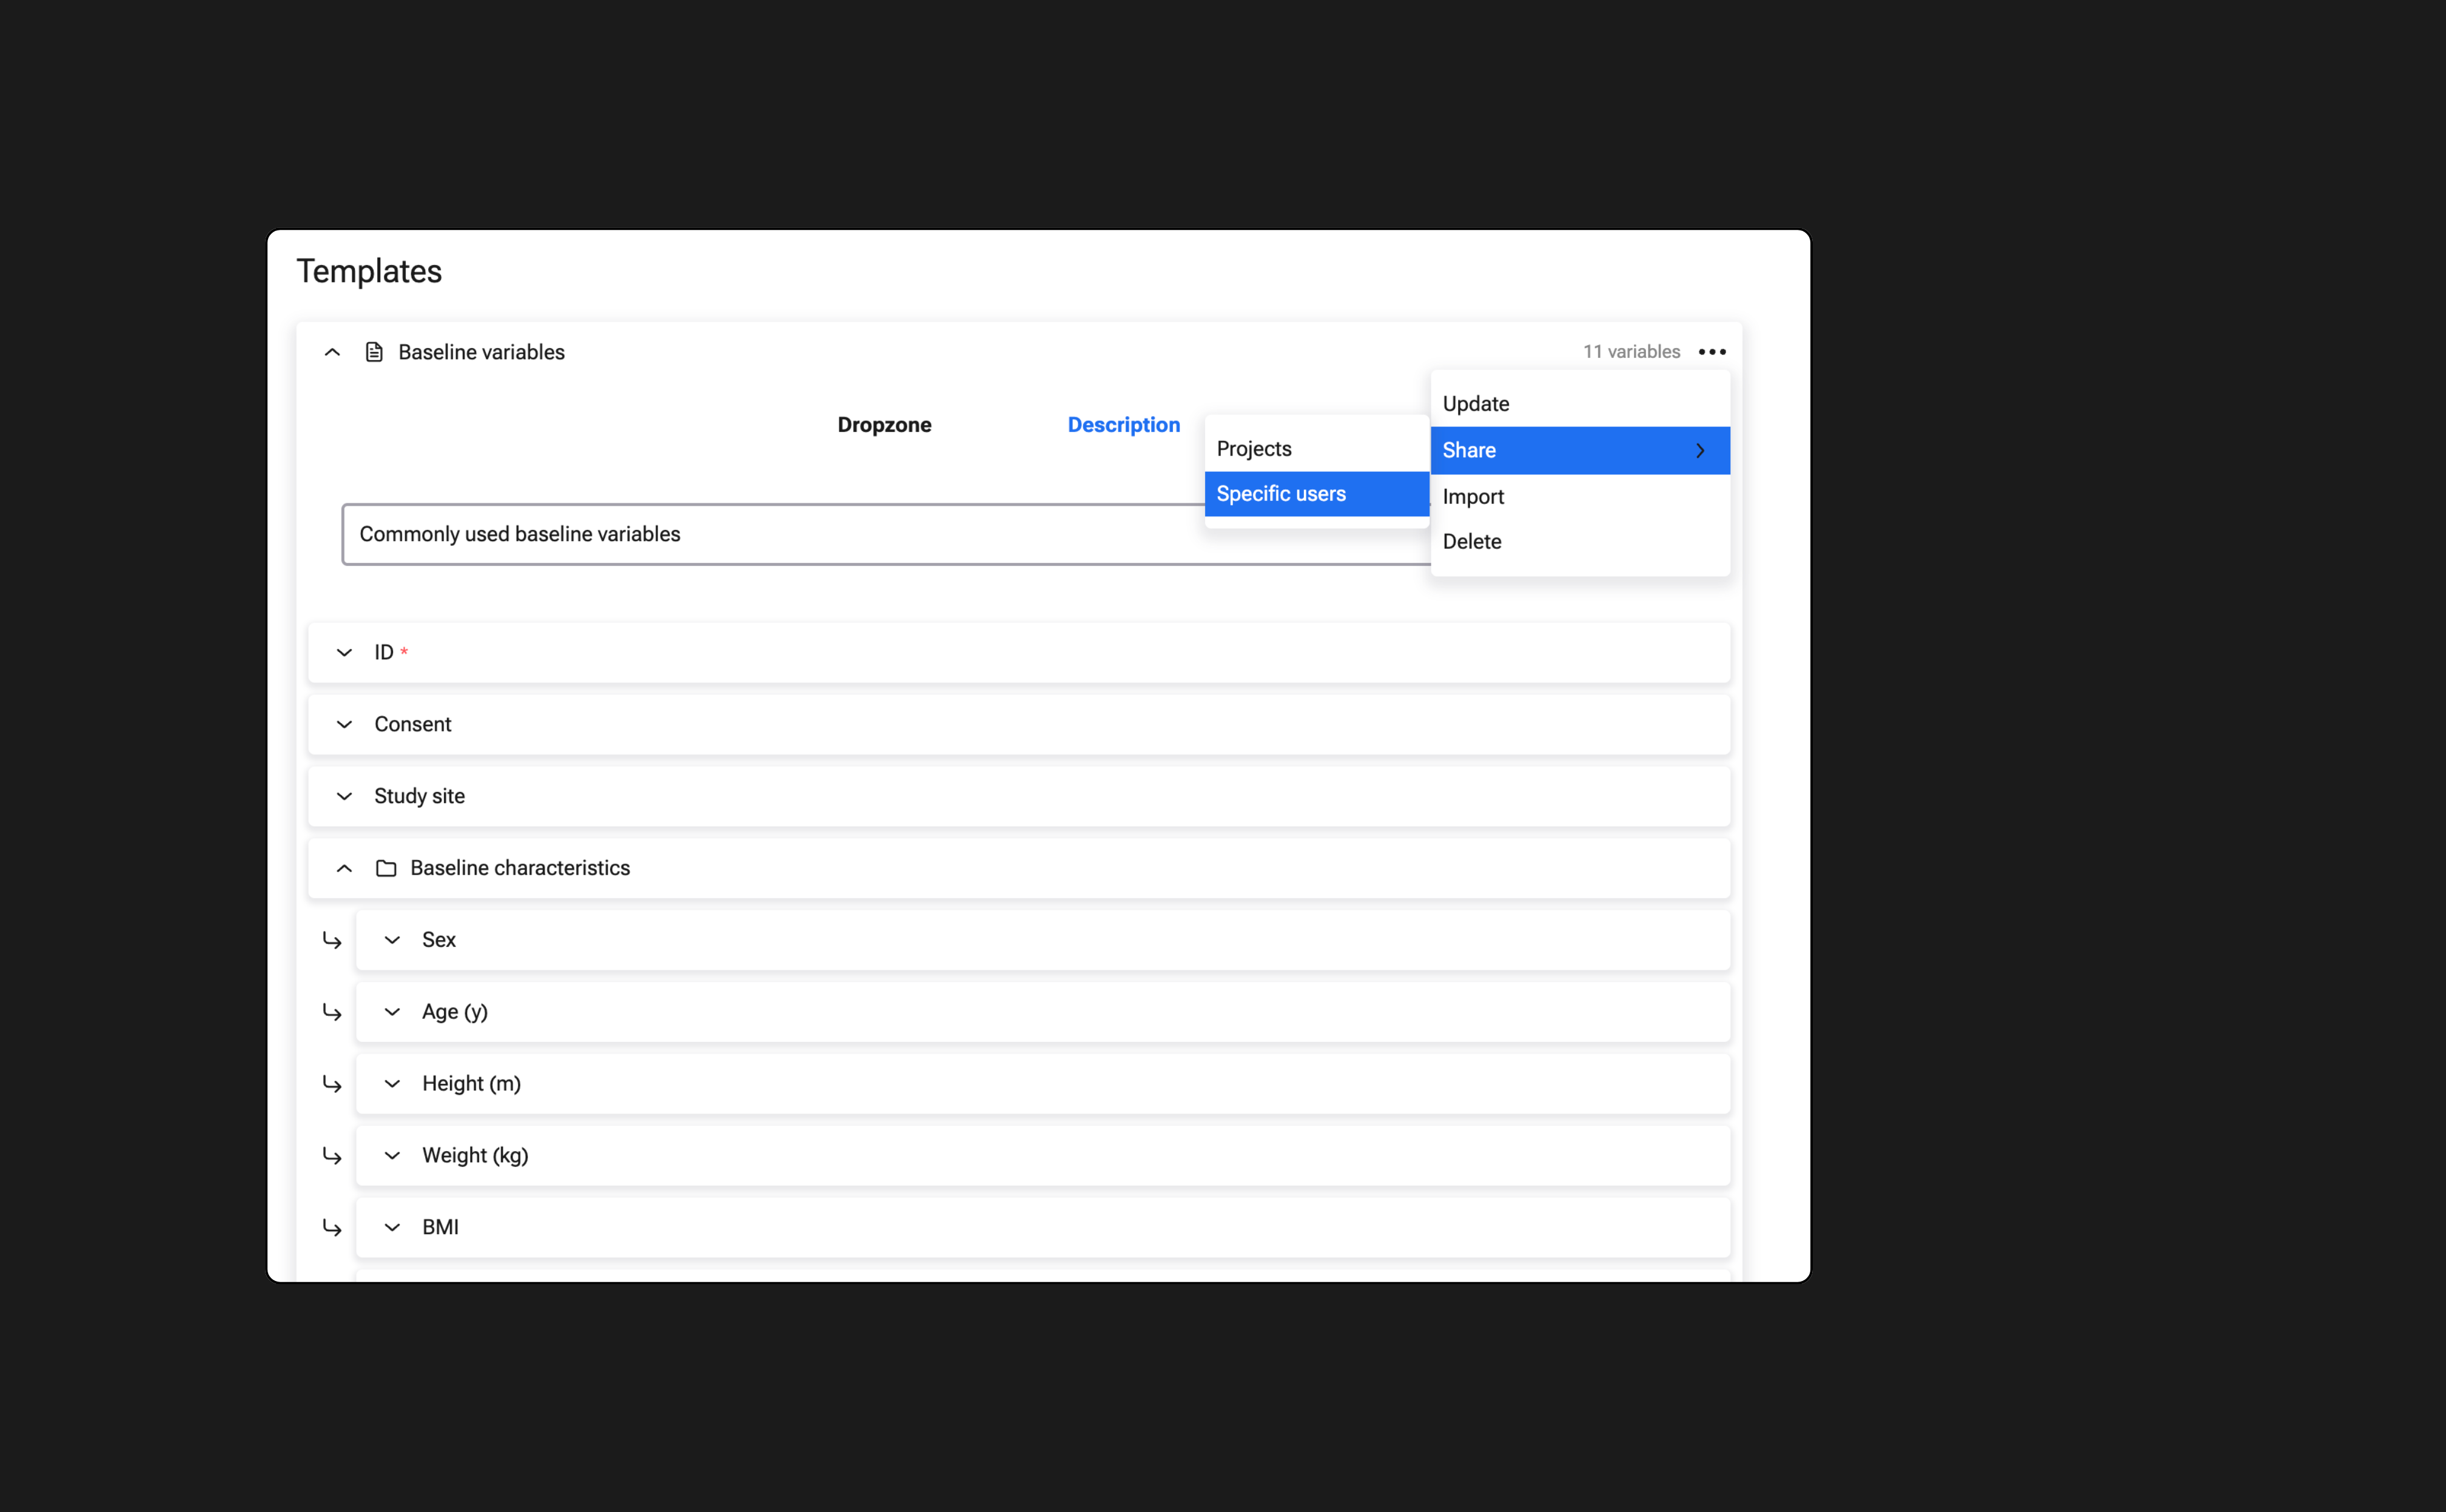
Too good to go? Reuse your templates
You can import templates from previous projects into new projects. Reuse of variables, or even complete study setup, saves time and supports standardisation across multiple studies and registries.
And of course, you can share your templates with other Ledidi users – research is truly a collaborative sport.
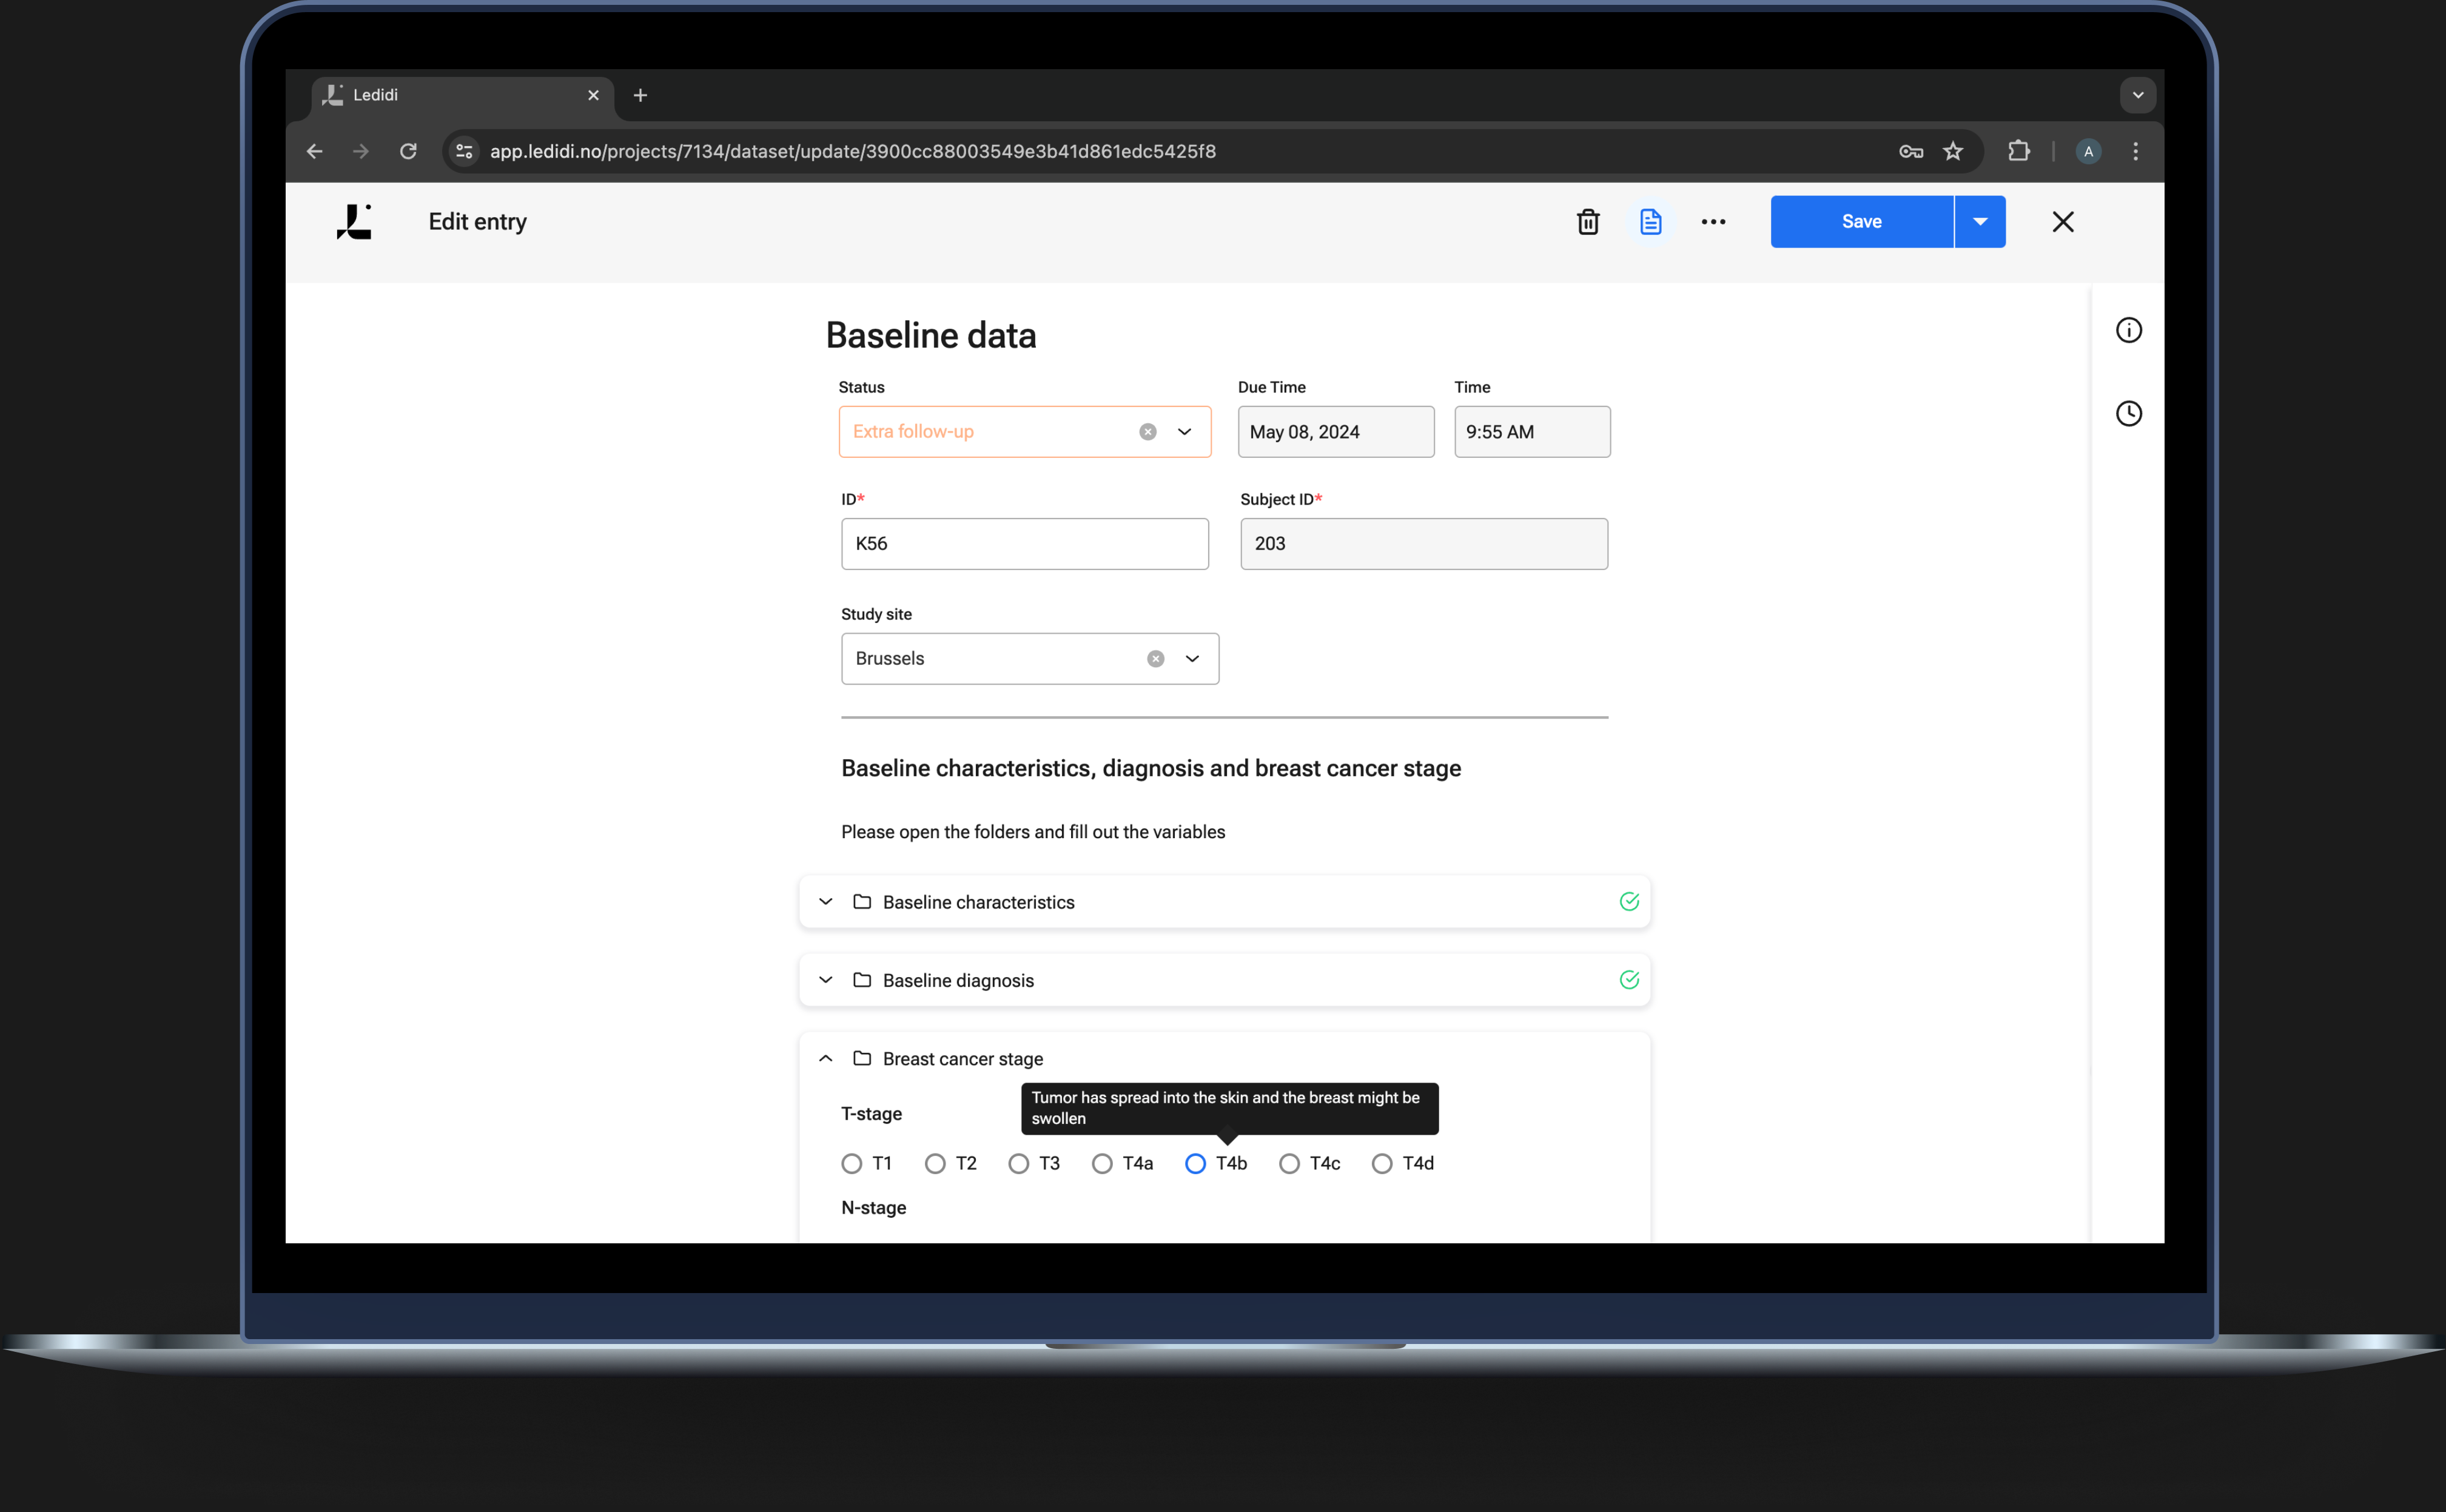
Effortless customisation
Create customised entry forms with additional subtitles, text elements and instructions.
This is useful when multiple collaborators need to register different data in the same entry form, or when data will be registered at different points in time.
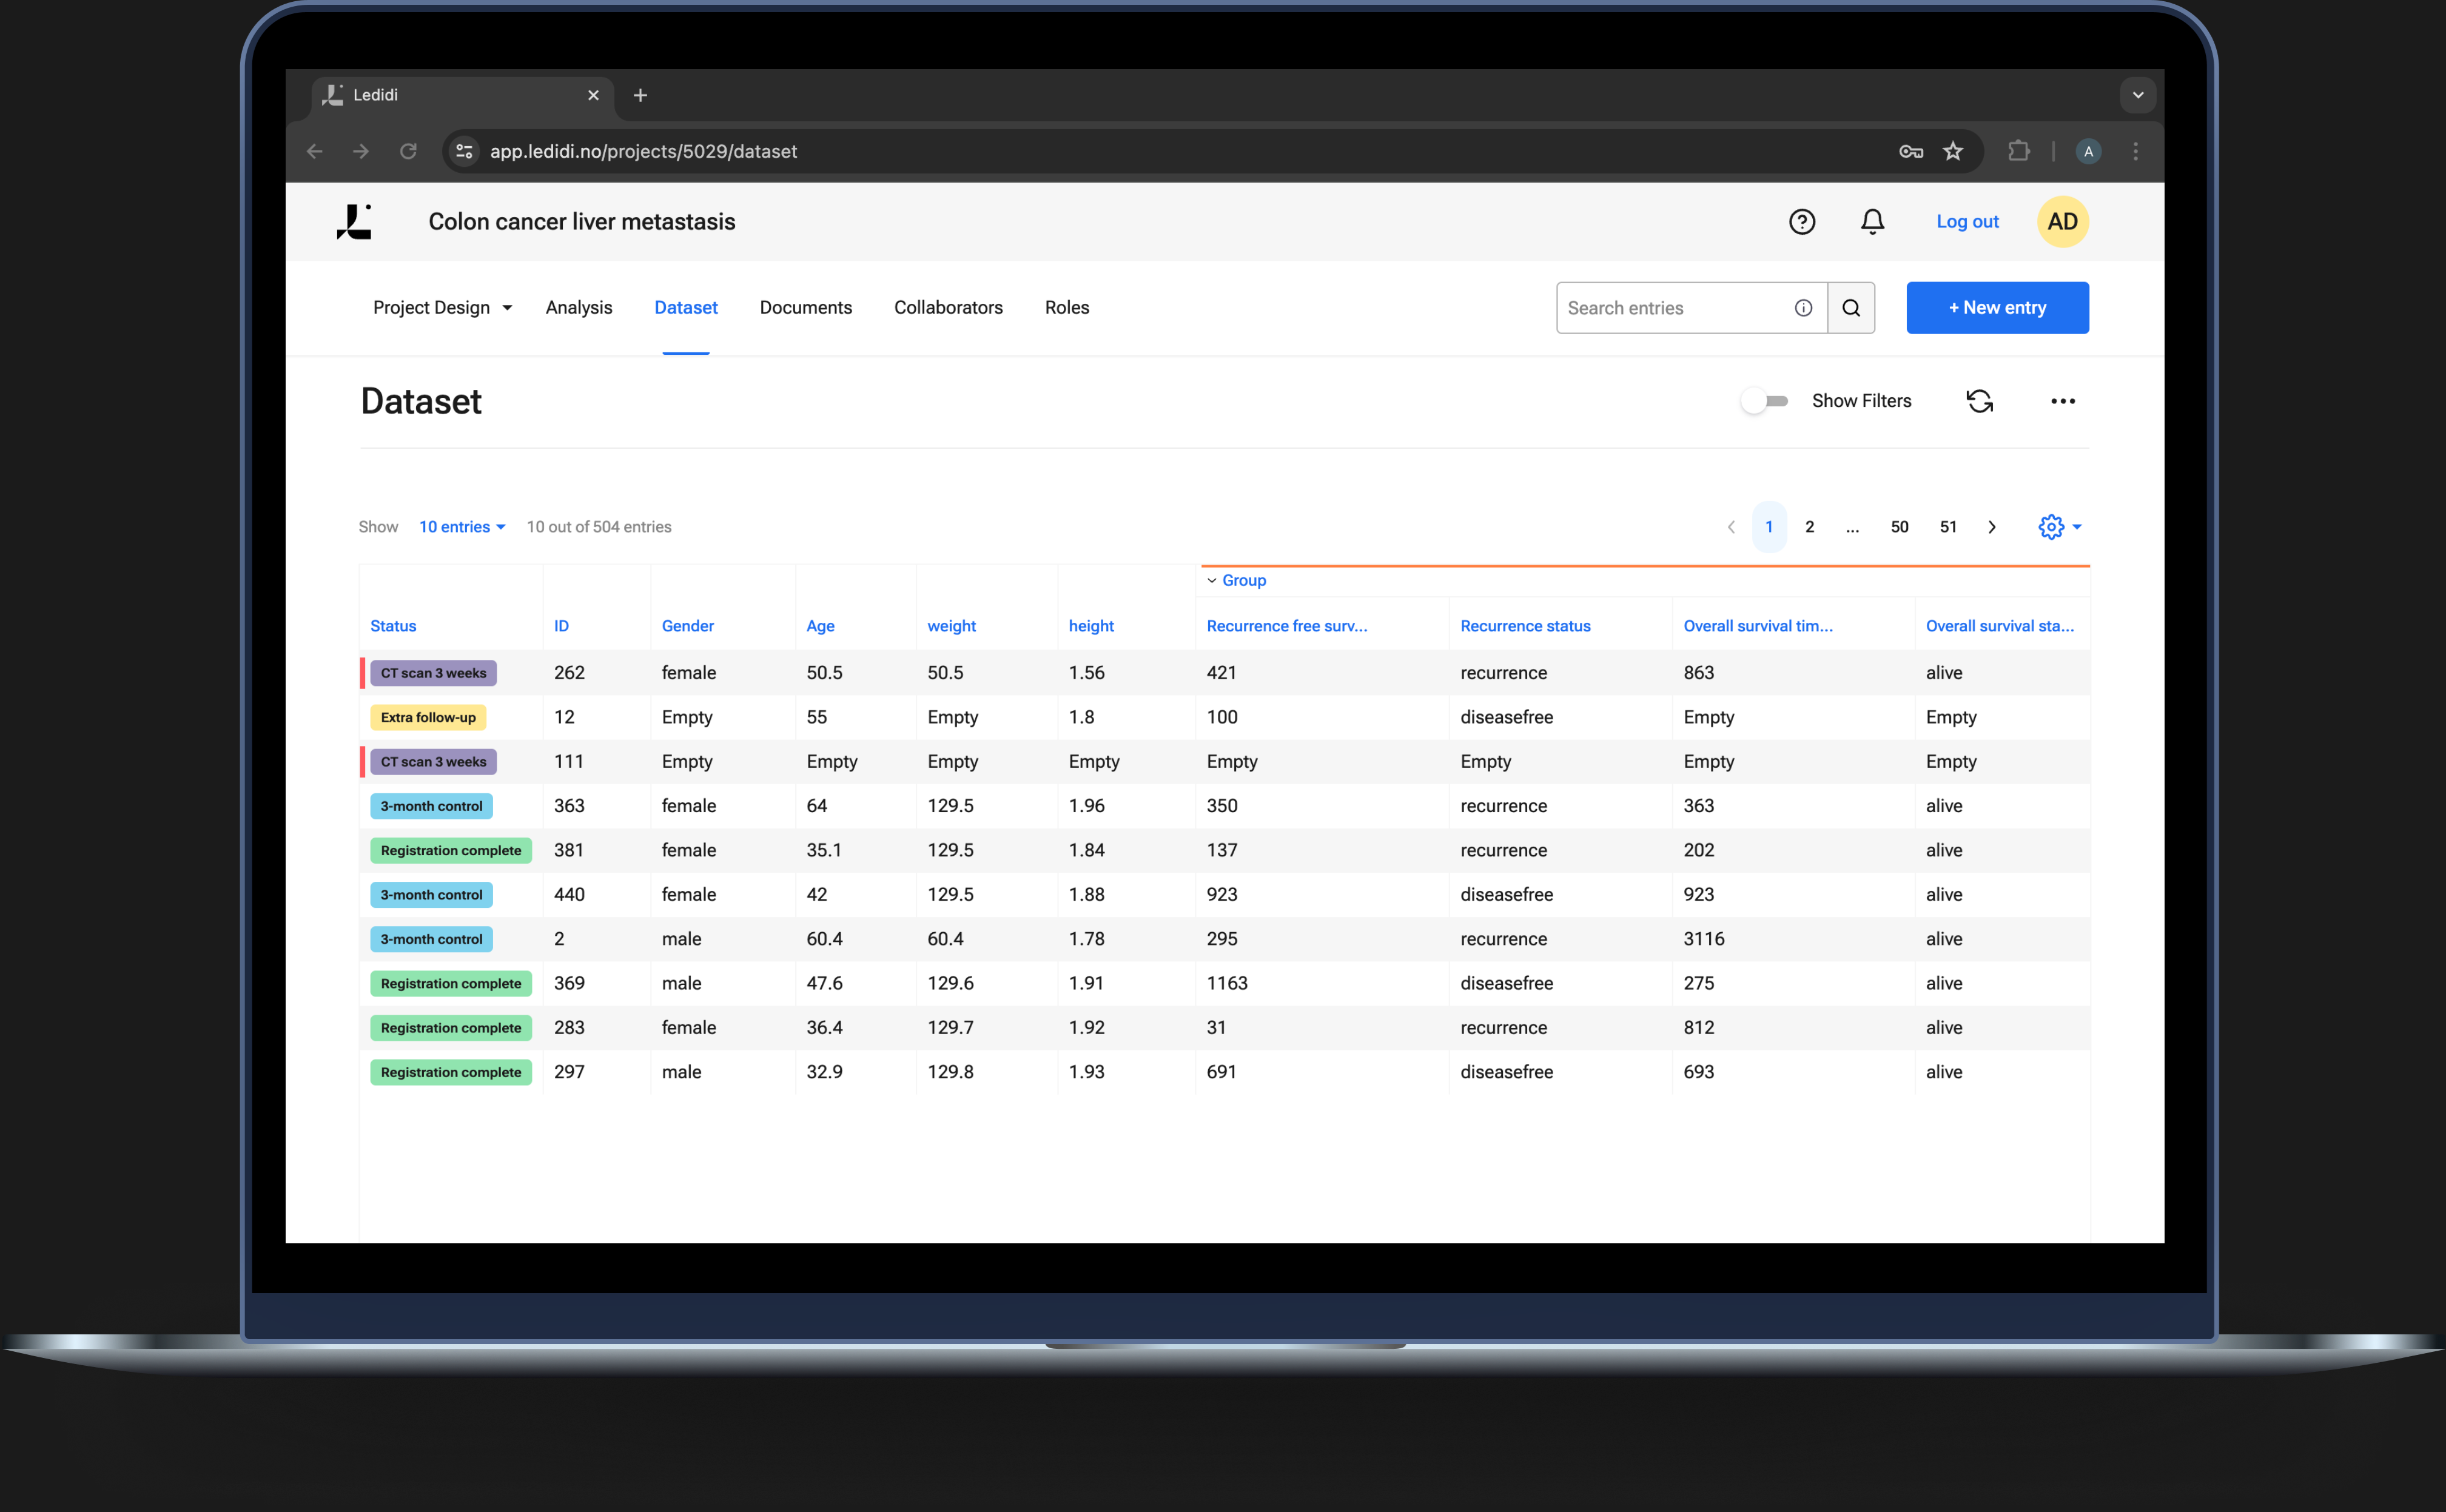
Keep track
By defining and setting statuses on the entries, you can easily keep track of the progress in the registration phase.
Entries can be sorted based on statuses in the dataset window and give you the overview you need.
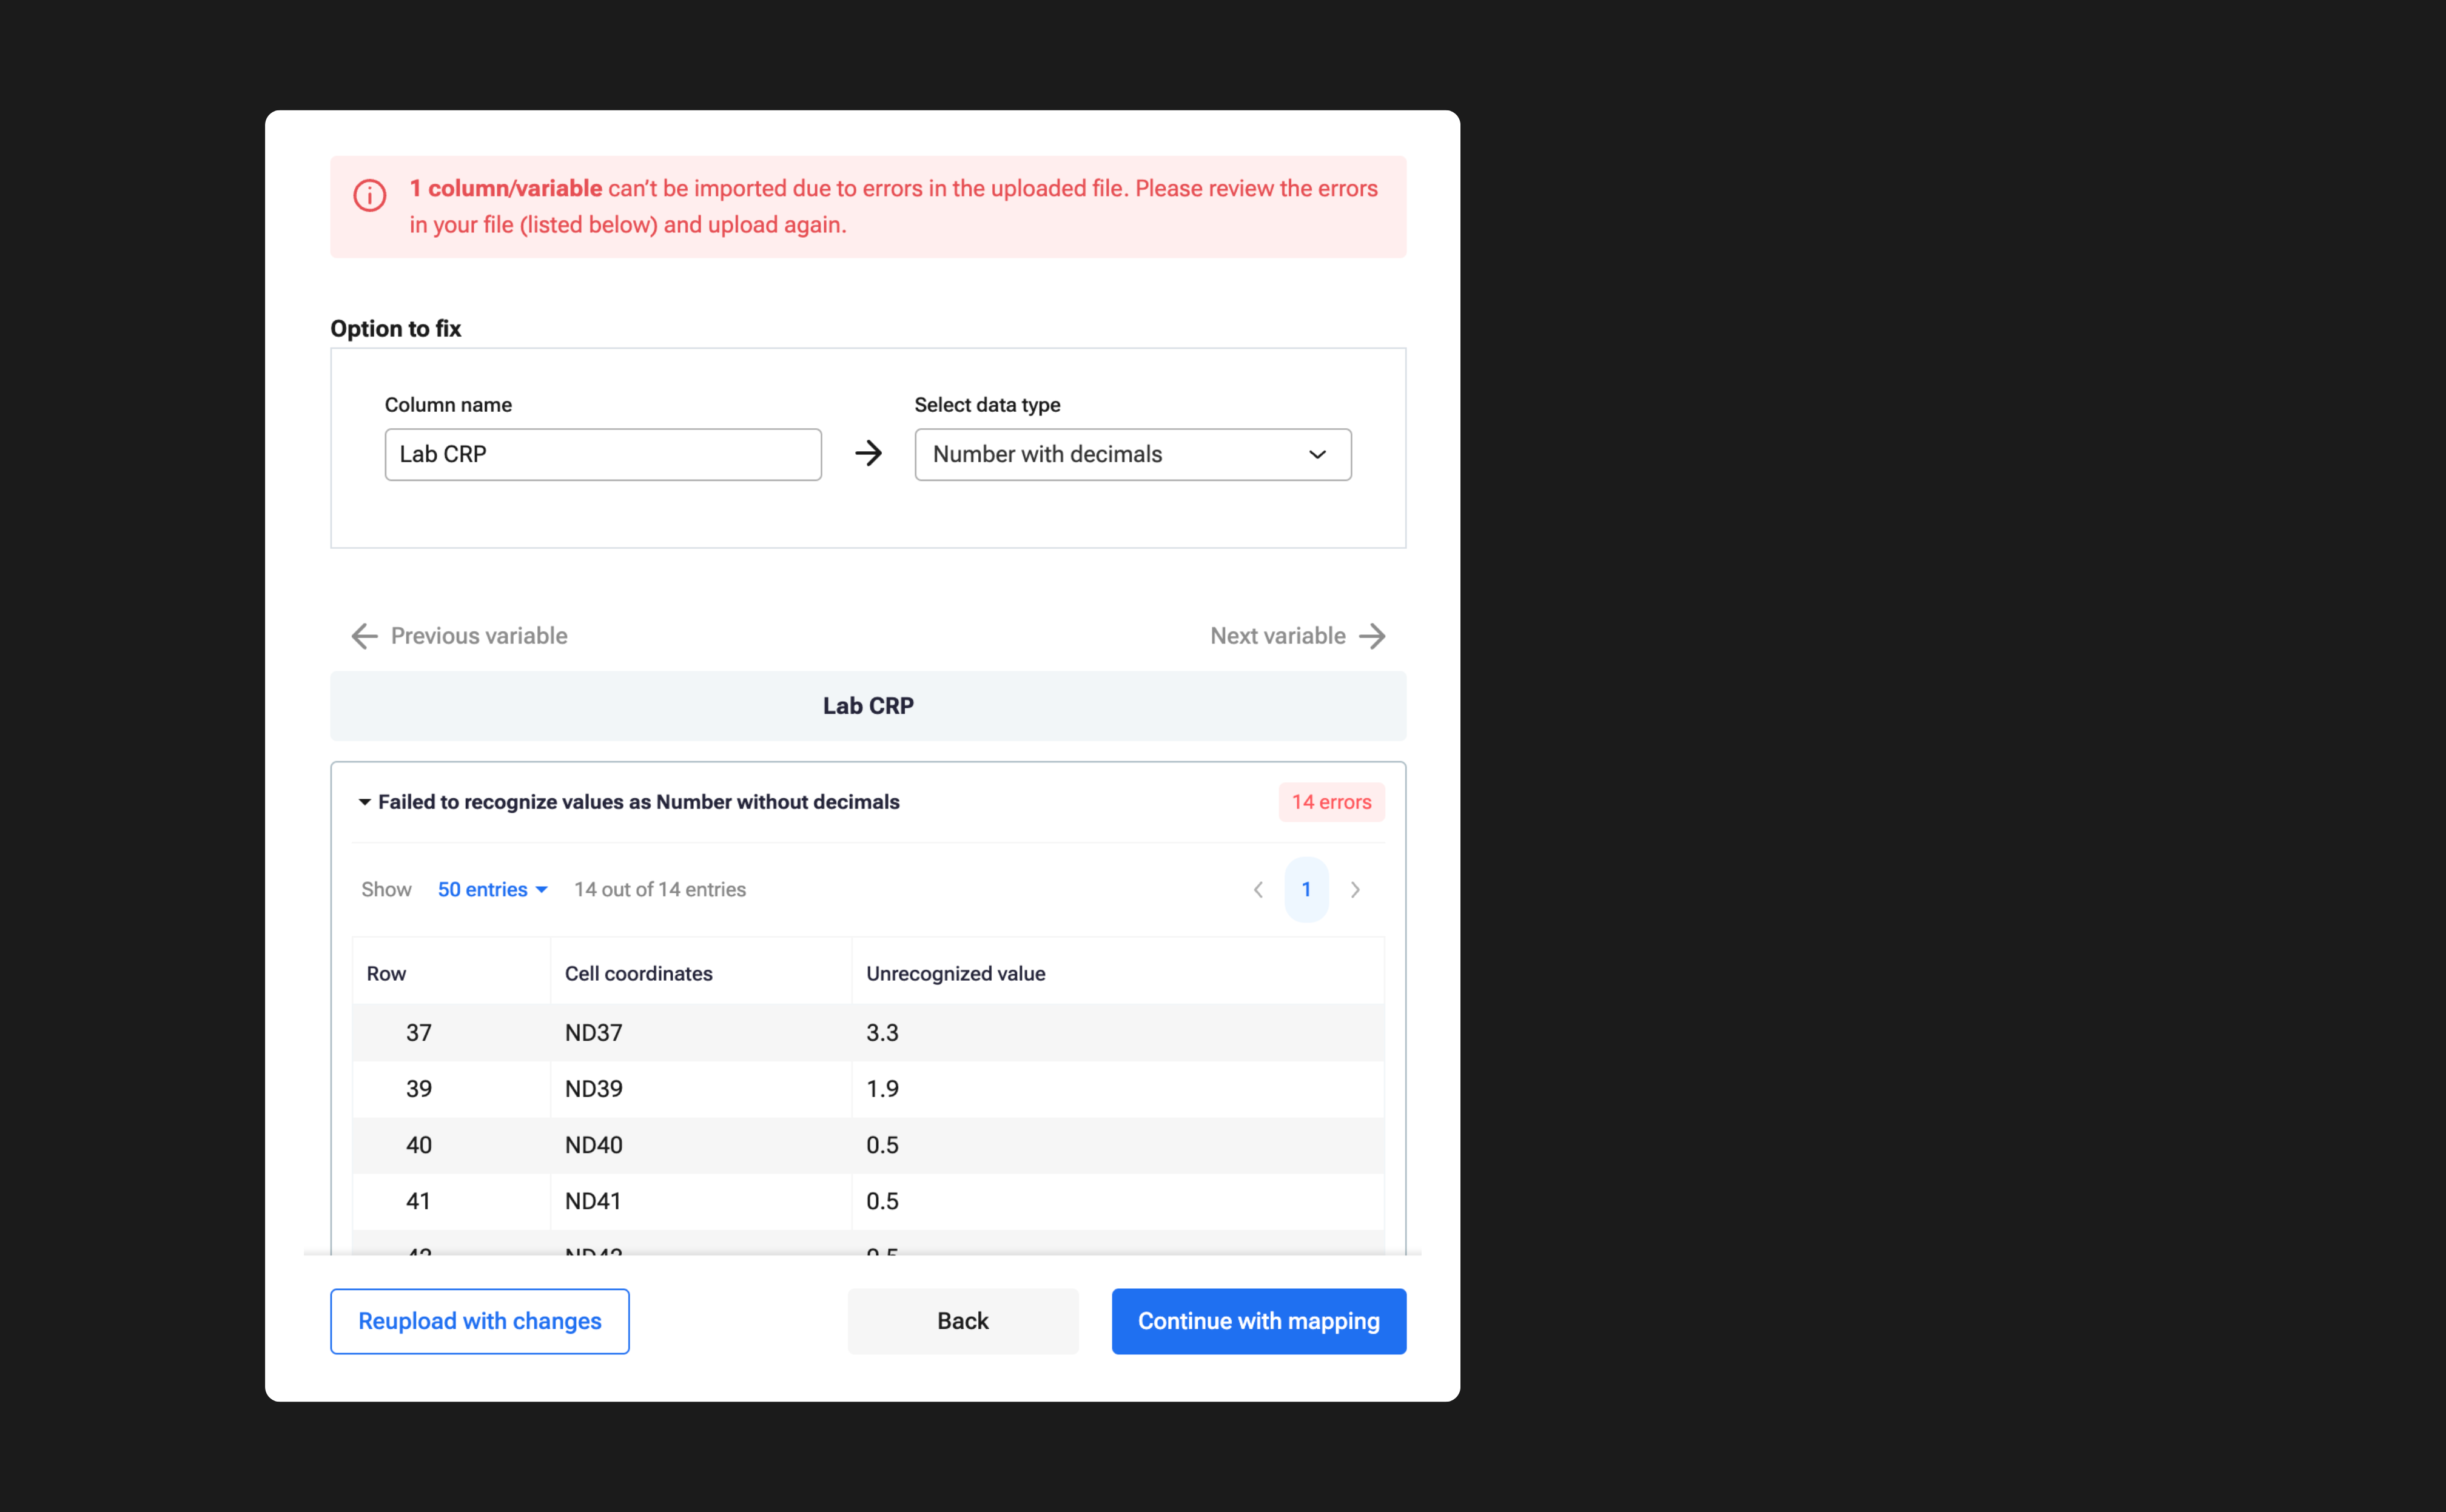
Ensure data quality
After a data import is completed, the platform automatically recognises the names and data types of all your variables. Any errors or inconsistencies will be immediately highlighted, pinpointing their exact locations within your import file.
This feature allows you to quickly address issues during the import process, either directly in the platform or by re-uploading the corrected file.
A repertoire of built-in descriptive and comparative statistical analyses
Choose from frequencies, explore, compare numeric values, cross tab, survival curves with Kaplan Meier plot, correlations and linear regression, plot numeric variables, density plot, time-course, logistic regression, compare paired samples analyses.
Use statistics and data visualisation to get real-time results. All analyses can be performed without exposing the underlying primary data.