Doing research, we often wish to say something about a larger population based on a sample from that population. Say you want to find out the mean height of grown women in a given country, you probably would not be able to measure the height of every single woman in the country. Rather, you would make a random selection of women, i.e. 200, measure their height, and calculate the mean height based on the collected values. But how certain can you be that this mean represents the true value of the population (the mean height of all women)? How confident can you be about your estimate? This is where the confidence interval will give you useful information.
To calculate the confidence interval, we sample a subset of the population and choose a confidence level, which is often set to 95% or 99%. The mean of the sample is the center of the confidence interval and the width depends on the variation in the data and the number of observations. We choose a confidence level of 95 %. In theory, if you were able to sample from the same population several times, 95% (1 in 20) of the confidence intervals will include the true population mean.
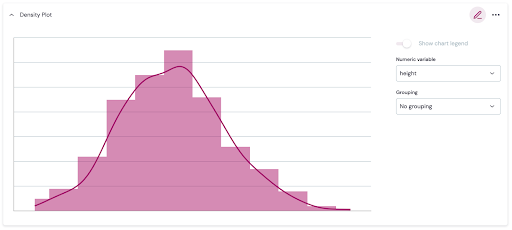
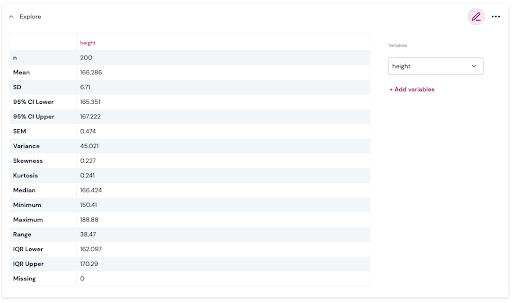
The distribution of 200 measurements of women’s heights is shown below. In addition, the mean, standard deviation and limits of a 95% confidence interval is easily found in the Analysis section of Ledidi Core. From this sample, the mean height is 166.286cm and a 95% confidence interval has lower and upper limits of 165.315cm and 167.222cm.
The correct interpretation of confidence intervals - and a common misunderstanding
A common misinterpretation of the confidence interval is that a 95% confidence interval means that there is a 95% probability that the true population mean is within the interval. However, this is a simplified interpretation. It is important to realize that confidence intervals relate to the sampling method and we use samples to make estimates of a true population parameter. Thus, if we repeat our sampling with the exact same methodology and construct intervals at 95% confidence level for each sample, 95% of the intervals will cover the true value of the population mean. In other words, the confidence relates to the sampling methodology, and not the probability the true population mean is within the interval produced by one specific sample.
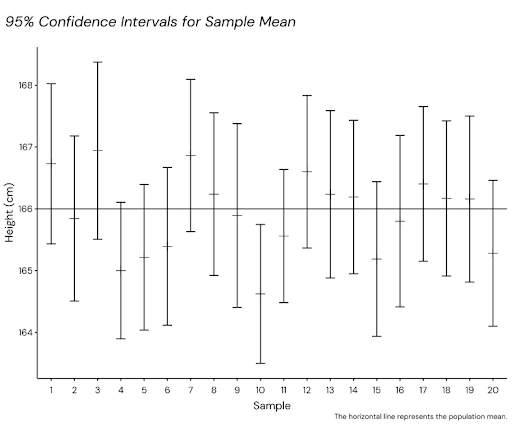
The figure below shows 20 confidence intervals for samples drawn from a fictional population of women with a true mean height of 166. As indicated by the confidence level of 95%, 19 of the intervals contain the true population mean.
The effect of increasing the sample size
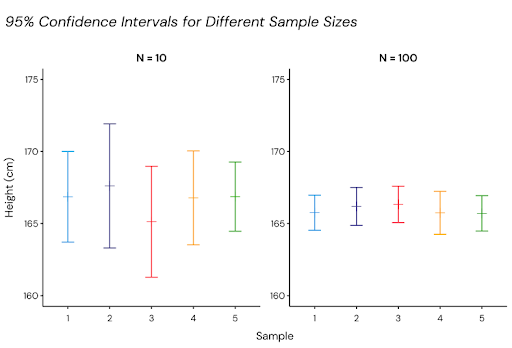
By increasing the sample size, the confidence interval shrinks because our confidence about the estimate increases. Sampling from the population of all women, we calculate the confidence intervals of five samples with size 10 and 100. The figure below shows how the sample size affects the width of the confidence intervals. By the definition of a confidence interval, 95% of the confidence intervals will contain the true value of the mean height of all women.
How to construct confidence intervals - z-scores versus t-scores
You can construct confidence intervals with z-scores or t-scores.
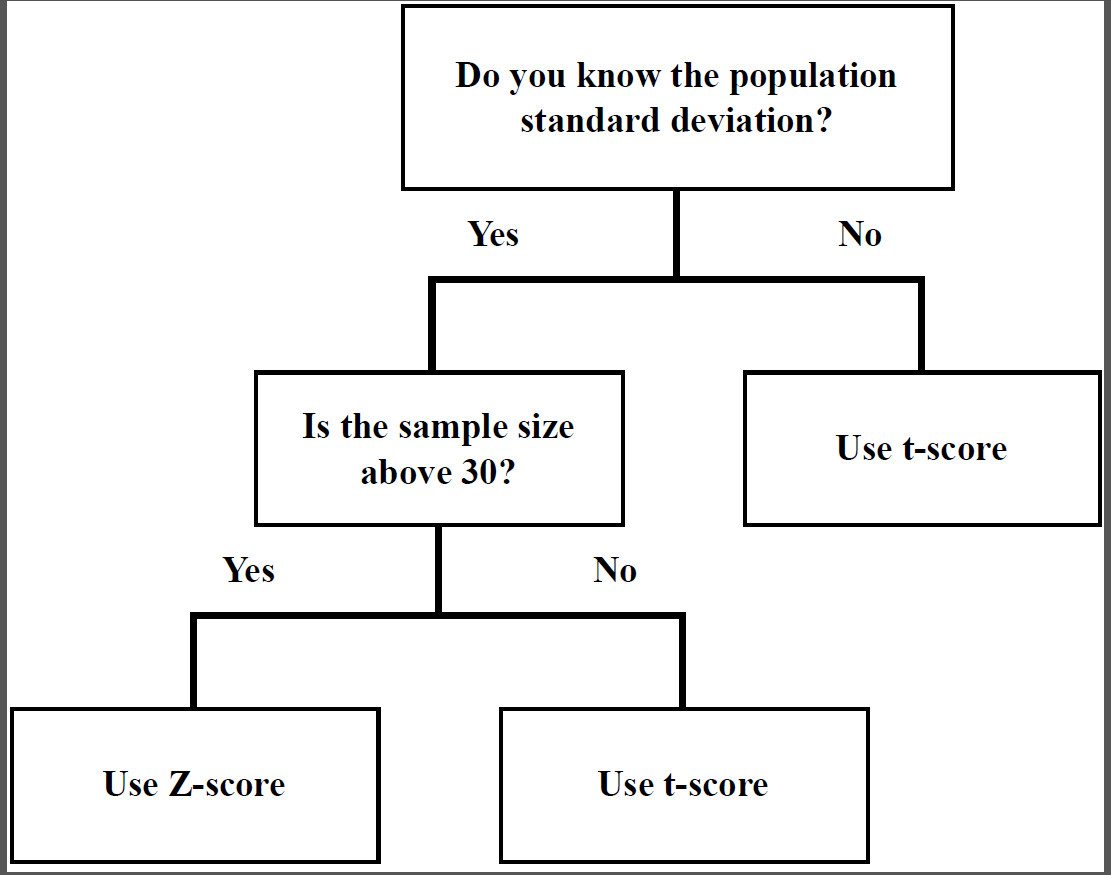
If we know the standard deviation of the population and the sample size is more than 30, we can use z-scores. We then use the sample mean and the standard normal distribution table to choose the appropriate z-score.
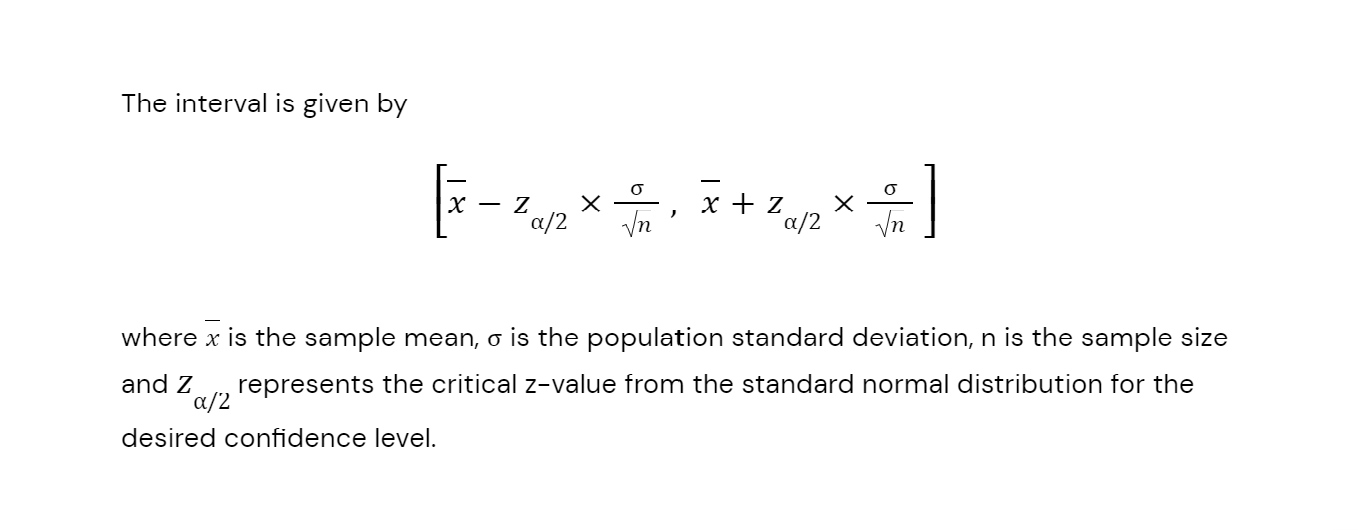
This interval is only exact when the population distribution is normal.
However, in most situations we do not know the standard deviation of the population or the sample size may be less than 30. We then need to use the t-distribution to compute the confidence intervals.
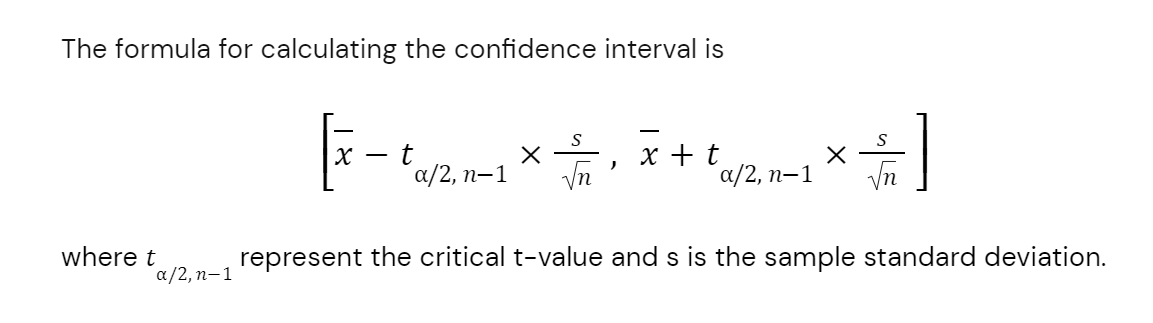
Like z-scores, t-scores represent the number of standard deviations from the sample mean in a t-distribution. However, t-scores are used when we don’t know the population standard deviation or the sample size is less than 30. If the population standard deviation is not known, we use the sample standard deviation as our estimate.
To construct a confidence interval for the mean of a sample of size n, we must find the critical value for the t-score in a t-distribution table using the confidence level that we choose and the degrees of freedom of the sample, which is n-1.
Latest From Ledidi Academy


The difference between association, correlation and causation
- Statistical analysis
- Tips and insights