The Z-score measures how many standard deviations a data point is from the population mean, and to illustrate the practical use of Z-scores, we’ll use an example based on waiting times in Norwegian hospitals. If you want to know how far the mean waiting time for a single hospital is from all hospitals, you can use the Z-score. The average waiting time across Norwegian hospitals in March 2022 was 61.13 days, and the standard deviation was 12.78. Lovisenberg hospital had an average waiting time of 78.72 days. How bad is this compared to the rest?
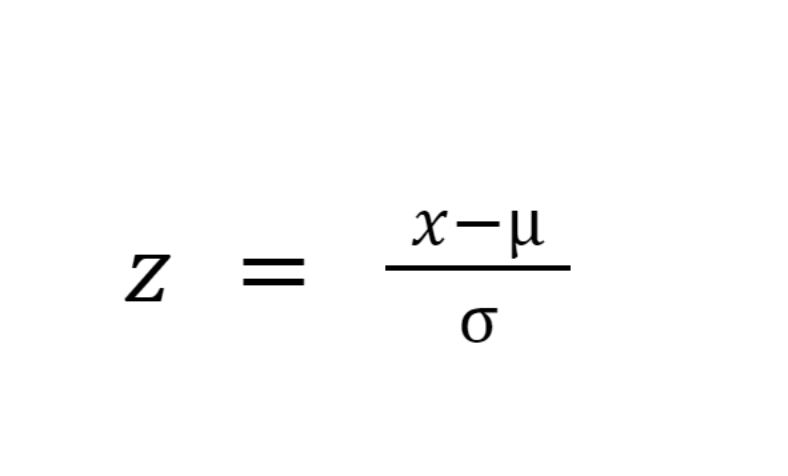
Using the Z-score, we can say how many standard deviations 78.72 days are from the mean. This value is the Z-score and is calculated by subtracting the population mean and dividing it by the population's standard deviation. This process is called standardization, and the formula is shown below.

where x is the raw score, is the population mean, and is the standard deviation of the population.
For Lovisenberg hospital, the calculation looks like this: (78.72 - 61.13) / 12.78 = 1.38. The Z-score is 1.38, which is 1.38 standard deviations above the mean.
As seen by the formula, a Z-score of 0 means that the raw score is equal to the mean. A positive Z-score means that the value is above the mean and a negative Z-score means the value is below. Furthermore, a Z-score of 1 indicates that the observation is one standard deviation above the mean.
We note that if we do not know the population's standard deviation, using Z-scores will be inaccurate, and we must use a t-score instead
Standard normal distribution
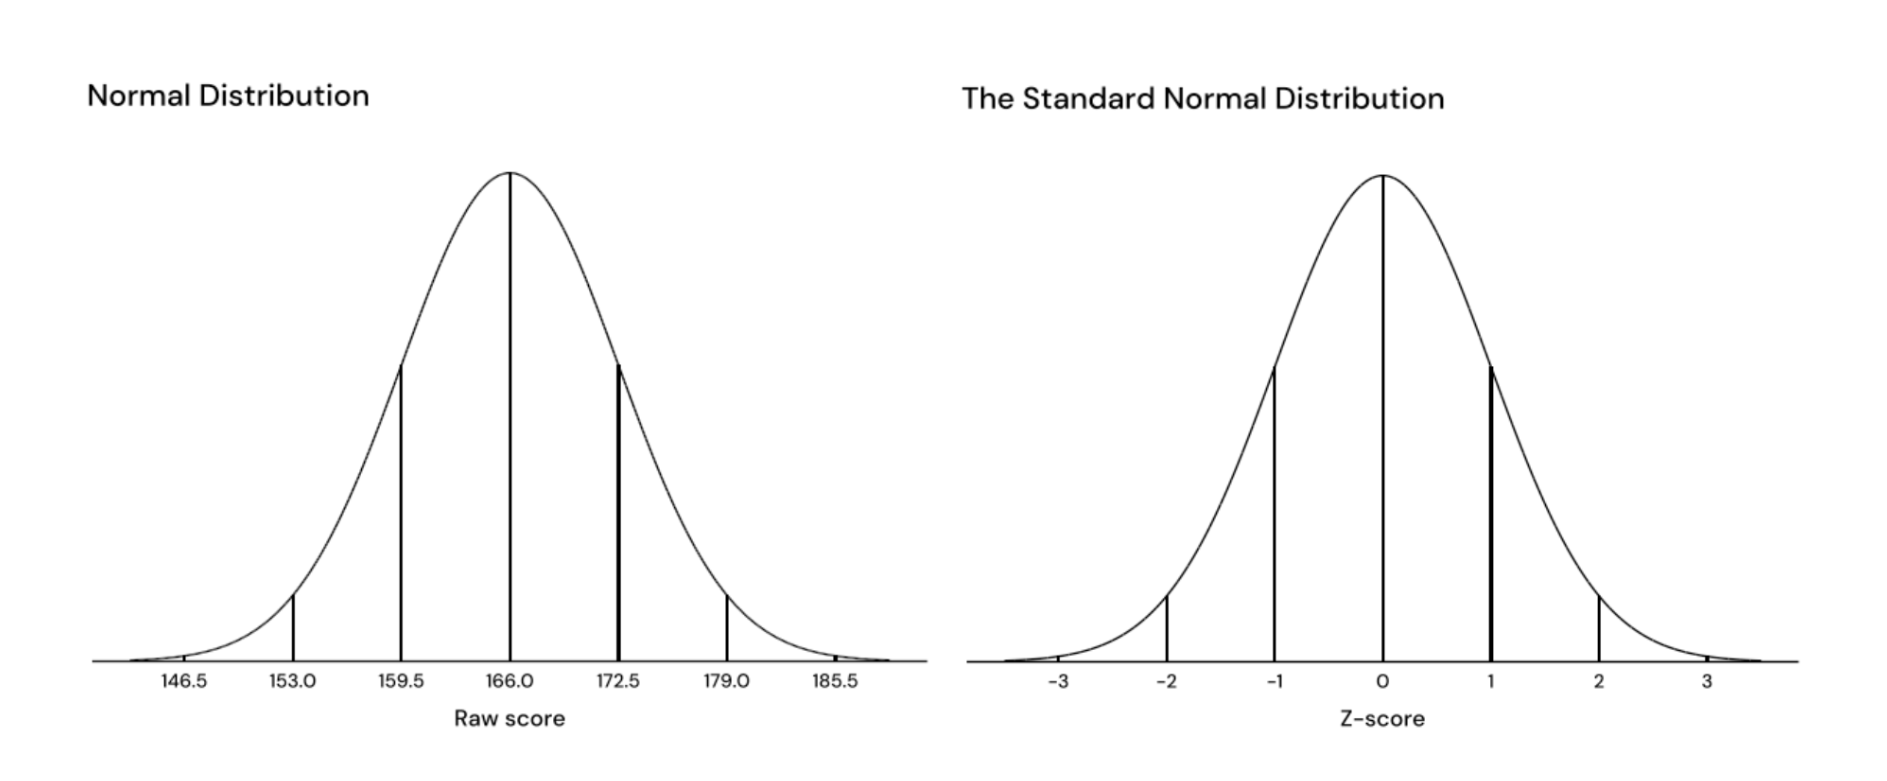
It is possible to standardize the values of an entire distribution, which means you standardize the entire curve. For example, the left graph of Figure 1 shows a normal distribution with a mean of 166 and a standard deviation of 6.5. By standardizing the distribution, we get the standard normal distribution, with a mean of 0 and a standard deviation of 1. The standard normal distribution is shown to the right in Figure 1.

Why are Z-scores useful?
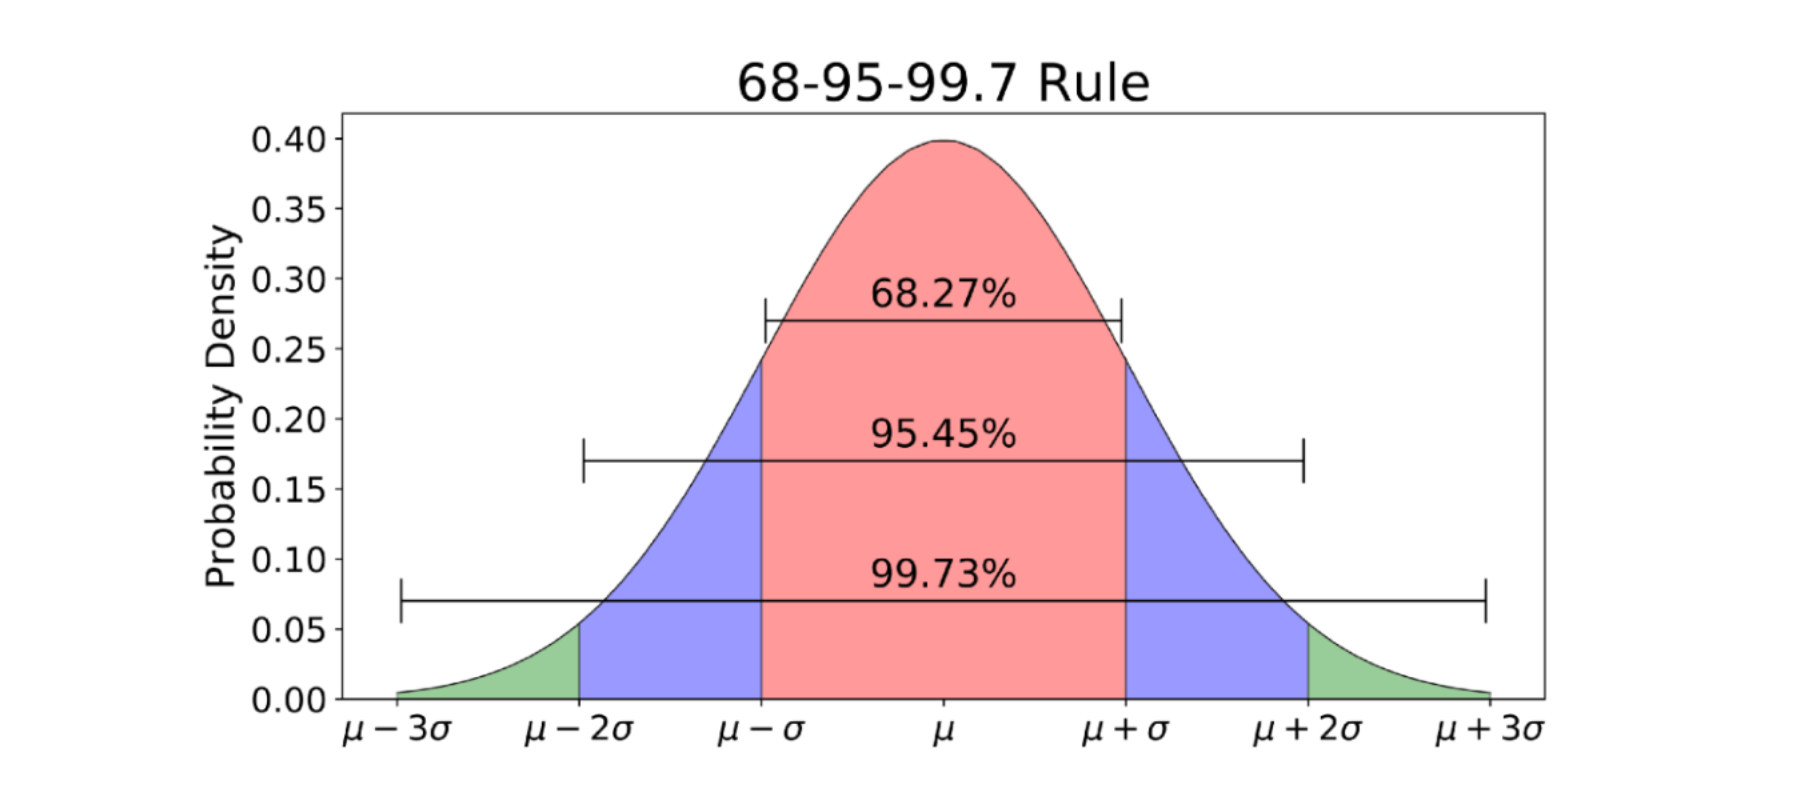
After converting a value to a Z-score, we can use the empirical rule to calculate probabilities and make forecasts. The rule states that for normal distributions 68,3% of the Z-scores will be within the range [-1, 1], 95,5% in [-2, 2], and 99,7% in [-3, 3] (Figure 2).

In addition, the Z-score can be used to find the exact probability of observing a value equal to or greater than the absolute value of the Z-score. Therefore, Z-scores allow us to
Calculate the probability of observing a value equal to or greater than the absolute value of the raw score, which is the p-value
Compare Z-scores from populations with different means and standard deviations
Calculate confidence intervals if we know the standard deviation of the population (not the standard deviation of our sample)
Perform a Z-test, which tests whether the sample mean is significantly different from the population mean under the null hypothesis
More From Ledidi Academy

The difference between association, correlation and causation
- Statistical analysis
- Tips and insights

